The graph shows the percentage of male and female academic staff members across the faculties of a major university in 2012

The graph shows the percentage of male and female academic staff members across the faculties of a major university in 2012
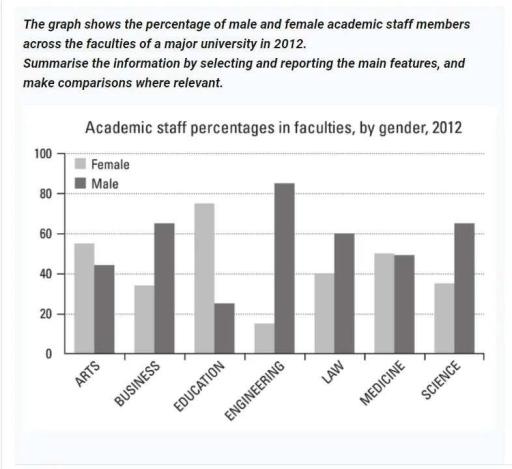
The given bar chart provides information about the rate of men and women academic staff members in different seven faculties (Arts, Business, Education, Engineering, Law, Medicine,
Sciecnce
Correct your spelling
science
) in the given year 2012.
Overall
,
the
Correct article usage
apply
show examples
female
Fix the agreement mistake
females
show examples
prefer working on education over any other faculties and dislike studying engineering more than any other faculties. Not
onlt
Correct your spelling
only
is
this
point clear, but
also
men work the most
on
Change preposition
in
show examples
engineering
while
education is a
facultiy
Correct your spelling
faculty
they work the least
percent
Change the spelling
per cent
show examples
.
Submitted by k26840q on

Unauthorized use and/or duplication of this material without express and written permission from this site’s author and/or owner is strictly prohibited. Excerpts and links may be used, provided that full and clear credit is given to Writing9 with appropriate and specific direction to the original content.

Sentences: Add more complex sentences.
Basic structure: Write more paragraphs.
Basic structure: Add more body paragraphs.
Common mistake: Your writing should be 150-250 words.
Basic structure: Write more paragraphs.
Vocabulary: Only 5 basic words for charts were used.
Vocabulary: The word "give" was used 2 times.
Vocabulary: Use several vocabularies to present the data in the second paragraph.
What to do next:
Look at other essays: