
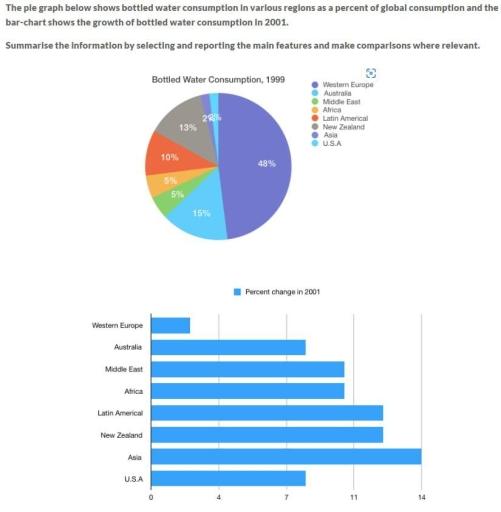
The given pie chart and bar chart provide insights into the
consumption
of bottled Use synonyms
water
across different regions of the world in 1999 and how it evolved by 2001. Use synonyms
Overall
, Asia emerged as the largest consumer of bottled Linking Words
water
at the outset of the Use synonyms
period
, Use synonyms
while
Western Linking Words
Europe
and the USA showed relatively lower levels of usage. By the end of the Use synonyms
period
, most regions (Asia, the Middle East, Africa, Latin America, New Zealand, Australia, and the USA) had experienced substantial Use synonyms
growth
in bottled Use synonyms
water
Use synonyms
consumption
, except for Western Use synonyms
Europe
.
Use synonyms
To begin
with, the Middle East and Africa Linking Words
initially
had low Linking Words
consumption
rates, each accounting for only 5% in 1999. Use synonyms
However
, by 2001, both regions had seen a significant increase of nearly 10% in bottled Linking Words
water
Use synonyms
consumption
. Use synonyms
Similarly
, Latin America and New Zealand, which started at 10% and 13%, respectively, in 1999, Linking Words
also
witnessed a comparable Linking Words
growth
rate by 2001, each reaching approximately 13%.
Equally obvious is that Asia led in bottled Use synonyms
water
Use synonyms
consumption
at the start of the Use synonyms
period
with 48%, maintaining its position by 2001 with a 14% increase. Use synonyms
In contrast
, Western Linking Words
Europe
experienced modest Use synonyms
growth
during Use synonyms
this
Linking Words
period
, around 3%. Notably, the USA showed a notable increase of nearly 8% in bottled Use synonyms
water
Use synonyms
consumption
in 2001, unlike Western Use synonyms
Europe
, which saw comparatively slower Use synonyms
growth
.Use synonyms