
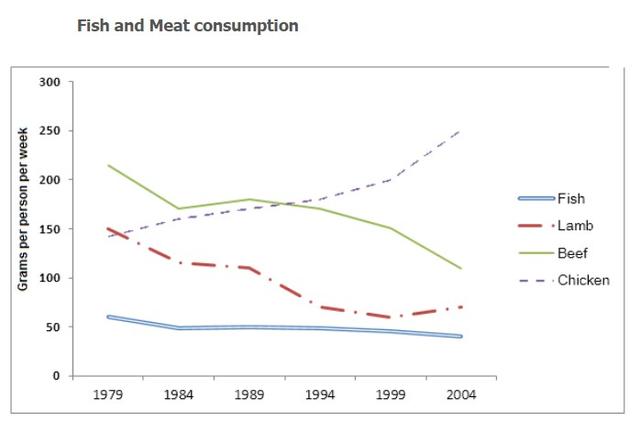
The given chart illustrates the total amount of 4 diverse types of meat namely fish, lamb,
beef
and Use synonyms
chicken
during a 25-year period. Use synonyms
Overall
, it can be seen that the production of lamp Linking Words
beef
and Use synonyms
chicken
witnessed a declining trend whilst the figure for fish had an increasing trend.And the consumption of fish meat was lowest throughout the period.
In 1979 the consumption of Use synonyms
beef
and Use synonyms
chicken
was approximately the same point by 150 Use synonyms
grams
. Use synonyms
Then
the figure for Linking Words
chicken
dramatically went up and reached the highest point at over 250 Use synonyms
grams
. Meanwhile, the amount of Use synonyms
chicken
meat plummeted to 70 Use synonyms
grams
The production of Use synonyms
beef
ranked first in 1979 with over 260 Use synonyms
grams
Use synonyms
then
gradually decreased to about 100 Linking Words
grams
in 1984 to 160 Use synonyms
grams
, Use synonyms
finally
, it steadily went down to finish the whole period in 2004Linking Words