
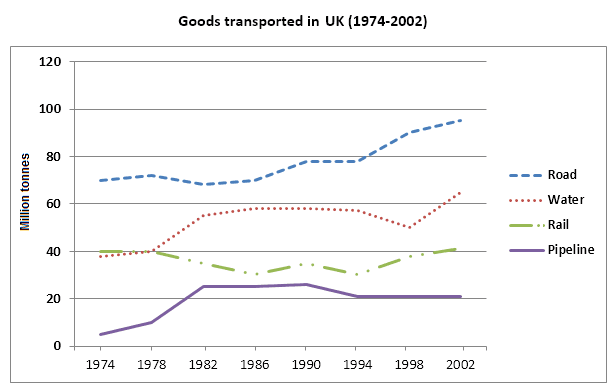
The given
ling
graph depicts the methods of moving goods in Correct your spelling
long
UK
during the period of 1974 to 2002 .
As can Correct article usage
the UK
be see
from the chartChange the verb form
be seen
that
, Correct pronoun usage
apply
Road
was the most Correct article usage
the Road
prefered
way to transport Correct your spelling
preferred
Fix the agreement mistake
goods
good
from one Correct your spelling
goods
Point
to another location followed by Water and y
rail.
In 1974, around 75 Fix capitalization
point
million
Use synonyms
tonnes
Use synonyms
Change preposition
of good
good
were transported by road. Fix the agreement mistake
goods
However
, it swelled Linking Words
singnificantly
and reached Correct your spelling
significantly
to
Change preposition
apply
approximatly
95 Correct your spelling
approximately
million
Use synonyms
tonnes
In 2002. Use synonyms
Furthermore
, water and rail were equally selected by Linking Words
Correct article usage
the Uk
Uk
in terms of transport around 40 Correct your spelling
UK
millions
Change to singular
million
tonnes
during the period 1974 to 1975. Meanwhile, water rose Use synonyms
grately
and Peaked Correct your spelling
greatly
around
65 Change preposition
at around
million
Use synonyms
tonnes
.
Use synonyms
According to
Linking Words
chart
, Pipeline mode was the Correct article usage
the chart
most
least Correct quantifier usage
apply
Prefered
way as compared to all other modes. Correct your spelling
Preferred
During
1974 to 1978, It was just around 5 Change preposition
From
million
Use synonyms
tonnes
. After Use synonyms
that
it Add a comma
that,
was
increased slightly in 1980 and Unnecessary verb
apply
maintain
Wrong verb form
maintained
Steadly
growth till 1993. From 1995 to 2002 it remained Stable Correct your spelling
Steady
around
23 Change preposition
at around
million
Use synonyms
tonnes
.Use synonyms