
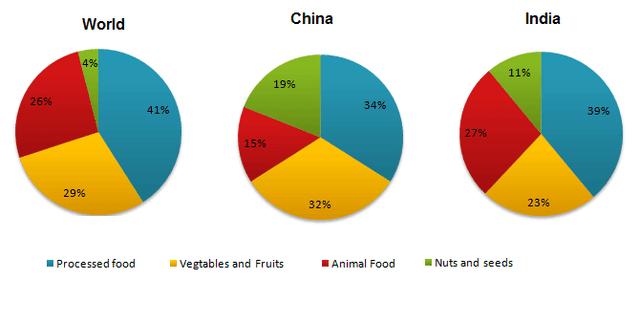
The given pie charts picture information about the
consumption
of Use synonyms
food
in the Use synonyms
world
in 2008. Compared to two countries Use synonyms
china
and Capitalize word
China
India
.
As Use synonyms
resealed
by Correct your spelling
revealed
consumption
of animals Use synonyms
food
was substantially worldwide 27 and in Use synonyms
India
26. The percentage of the average Use synonyms
consumption
of vegetables and fruits was 32% in China.Use synonyms
On the other hand
, these raw materials only contribute 23% of Indians and 29 % of the Linking Words
world
’s.
People in the Use synonyms
world
Use synonyms
Use synonyms
consumption
41% consumed Replace the word
consumed
food
in 2008 years, Use synonyms
this
Linking Words
food
was much Use synonyms
popular
Correct quantifier usage
more popular
Linking Words
then
Replace the word
than
others
Correct quantifier usage
other
food
.Use synonyms
India
used 39%. Processed Use synonyms
food
Use synonyms
whereas
Linking Words
Chinese
people ate 5% less than Use synonyms
India
.
is worth noticing that Use synonyms
Indian
ate more animal foods than Fix the agreement mistake
Indians
Use synonyms
Chinese
did Correct article usage
the Chinese
while
Linking Words
Use synonyms
Chinese
devoured more vegetables, fruits and seeds than Correct article usage
the Chinese
Indians
. On Correct article usage
the Indians
an
average, Correct article usage
apply
Indian
population consumed more animal foods and Correct article usage
the Indian
seeds
items than the Fix the agreement mistake
seed
world
population Use synonyms
while
Linking Words
Chinese
people ate more Use synonyms
vegetable
and seeds than the rest of the Fix the agreement mistake
vegetables
world
Use synonyms