
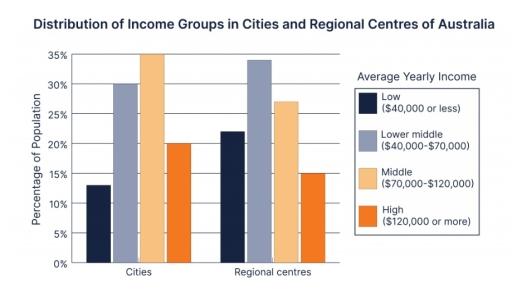
The bar chart illustrates different categories of average
income
in urban areas and regional Use synonyms
centres
of Australia. It can be seen that urban residents have more population in middle and high Use synonyms
income
and less Use synonyms
lower
middle and Change the word
low
low
Add a hyphen
low-income
income
categories in comparison with regional Use synonyms
centres
.
Use synonyms
Low
Add a hyphen
Low-income
income
group is approximately 13% of society in Use synonyms
cities
Use synonyms
while
Linking Words
this
rate is around 22% in regional Linking Words
centers
. Change the spelling
centres
Lower
Correct article usage
The lower
middles
Change the noun form
middle
income
group is 30% in Use synonyms
cities
and the latter is less than 35%.
Middle Use synonyms
income
in Use synonyms
cities
is 35% which Use synonyms
this
rate is about 8% less than regional Linking Words
centres
. Use synonyms
Linking Words
Furthermore
people with Add a comma
Furthermore,
high
average Add an article
the high
a high
income
in Use synonyms
cities
is 20% and the percentage for the regional Use synonyms
centres
is just 15%.Use synonyms