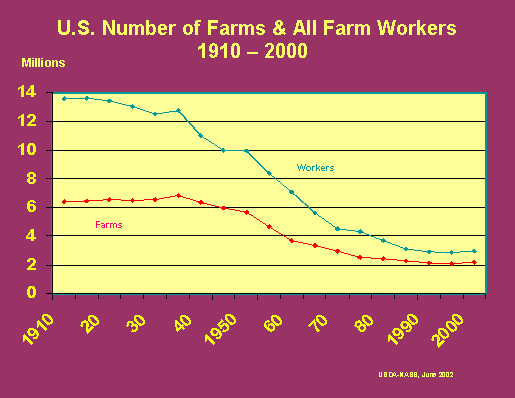
To the right is a line graph which shows the number of farms and farm workers in the United States from 1910 – 2000. Describe the information in the graph.

7.0 / 9
✍️ Want to check your own essay?Write on this topic →
To the right is a line graph which shows the number of farms and farm workers in the United States from 1910 – 2000. Describe the information in the graph.
IELTS Writing Task Chart for To the right is a line graph which shows the number of farms and farm workers in the United States from 1910 – 2000. Describe the information in the graph.
The line graph illustrates the number of farms and farm
workers
Use synonyms
in the United States from 1910 to 2000, expressed in millions.
Overall
Linking Words
, it is evident that the numbers of both farms and farm
workers
Use synonyms
experienced reductions over the period, with a substantial decline in the
figure
Use synonyms
for
workers
Use synonyms
. Regarding the number of farms, the
figure
Use synonyms
slightly increased from around 6.1
million
Use synonyms
to 6.5
million
Use synonyms
between 1910 and 1935, before significantly decreasing to approximately 2
million
Use synonyms
in 1990. Afterwards, it remained largely unchanged until 2000.
However
Linking Words
, the number of farm
workers
Use synonyms
moderately decreased from around 13.5
million
Use synonyms
to 12.3
million
Use synonyms
between 1910 and 1930, after which it rose to 13
million
Use synonyms
in 1935.
Thereafter
Linking Words
, the
figure
Use synonyms
considerably declined to 10
million
Use synonyms
in 1945 and remained unchanged until 1950.
Following
Linking Words
this
Linking Words
, it sharply fell to around 4.2
million
Use synonyms
in 1970, and
then
Linking Words
it steadily decreased to around 2.5
million
Use synonyms
in 1990.
Finally
Linking Words
, the
figure
Use synonyms
ended at around 2.7
million
Use synonyms
in 2000.

Unauthorized use and/or duplication of this material without express and written permission from this site's author and/or owner is strictly prohibited. Excerpts and links may be used, provided that full and clear credit is given to Writing9 with appropriate and specific direction to the original content.

Sentences: Add more complex sentences.
▼
Conclusion: The conclusion is too long.
Vocabulary: Rephrase your introduction. Words match: 75%.
▼
Vocabulary: Replace the words workers, figure, million with synonyms.
▼
Vocabulary: Rephrase the word "number of" in your introduction.
▼
Vocabulary: The word "figure" was used 4 times.
▼
Vocabulary: The word "figure" was used 4 times.
▼
Vocabulary: The word "number of" was used 4 times.
▼
Vocabulary: The word "decline" was used 2 times.
▼
Vocabulary: The word "decreased" was used 2 times.
▼
Vocabulary: The word "remained" was used 2 times.
▼
Vocabulary: The word "unchanged" was used 2 times.
▼
Vocabulary: The word "around" was used 5 times.
▼
Topic Vocabulary:
  • steadily declined
  • sharp decrease
  • fluctuated
  • peaked
  • plateaued
  • consistent downward trend
  • correlation
  • inverse relationship
  • notable increase
  • plunge
  • coincide
  • drastically
  • proportionally
  • trends
  • timeline
  • significant change
  • marked difference
  • fell dramatically
What to do next:
Look at other essays: