
One study about the fast
food
in Britain was focus in two topic: the first part showed the amount of money per Use synonyms
week
that british people spent in junk Use synonyms
food
, and Use synonyms
on the other hand
the investigation showed the trends of Linking Words
consumption
in fast Use synonyms
food
.
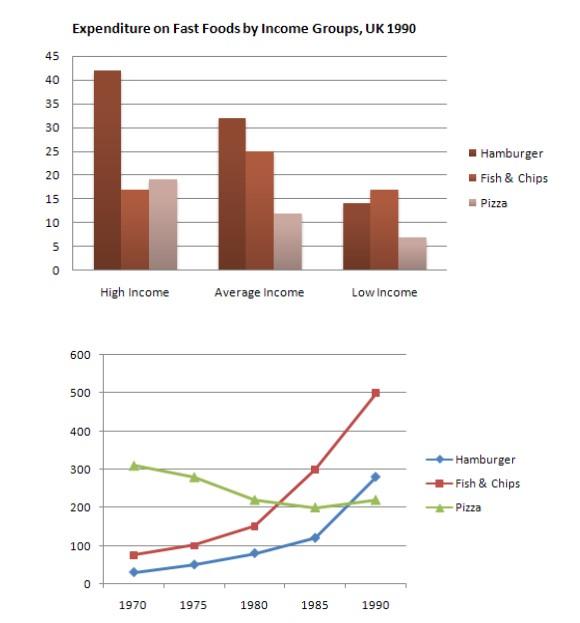
The research split the amount of money per Use synonyms
week
in three kind of social income: high, average and low, where the investigation figure out that the high income spent 45 pounds per Use synonyms
week
, and the low income waste 7 pounds per Use synonyms
week
. Use synonyms
Also
, the study showed that fast Linking Words
food
most popular Use synonyms
consumption
was hamburger and the pizza was chose like the fewer favorite.
Beside, the study show the habits of Use synonyms
consumption
of fast Use synonyms
food
in three decades (1970-1990), where the investigation reveals that fish and chips have been decresse their Use synonyms
consumption
and the hamburger and pizza have been increese their popular in the people in Britain.
Use synonyms
Nevertheless
the favorite fast Linking Words
food
in Britain is Hamburger, because the people in 1990 Use synonyms
consumption
500 grammes.Use synonyms