
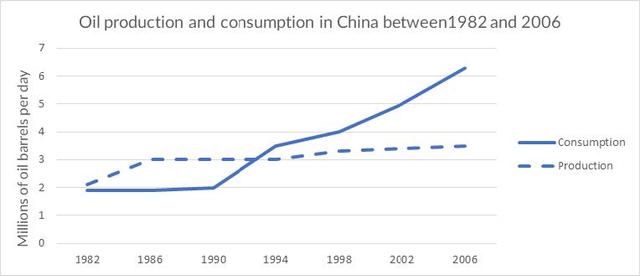
The chart depicts the manufacturing and consumption of
oil
in China from 1982 until 2006. It is evident that Use synonyms
while
the production of Linking Words
oil
rose at a steady rate, the consumption of fuel was increasing at a rapid pace. The extraction of fossil fuels could not keep up with the usage of the country. To elaborate, there was a sharp climb Use synonyms
of
Change preposition
in
oil
production from the beginning of 1982 until 1986 from two Use synonyms
million
to three Use synonyms
million
Use synonyms
barrels
per day. After 1986, the number of Use synonyms
barrels
being manufactured only gradually increased for the next twenty years until it reached its peak of three and a half Use synonyms
million
Use synonyms
barrels
in 2006, the end of the graph. Use synonyms
On the other hand
, starting from 1982, the consumption of fossil Linking Words
fuel
barely grew for eighteen years. Fix the agreement mistake
fuels
Furthermore
, the usage of Linking Words
oil
was slightly below two Use synonyms
million
Use synonyms
barrels
per day Use synonyms
in
the beginning year of the graph and only rose to two Change preposition
at
million
in 1990. From there, the rate began to significantly climb up until it reached a staggering amount of over six Use synonyms
million
Use synonyms
barrels
in 2006.Use synonyms