
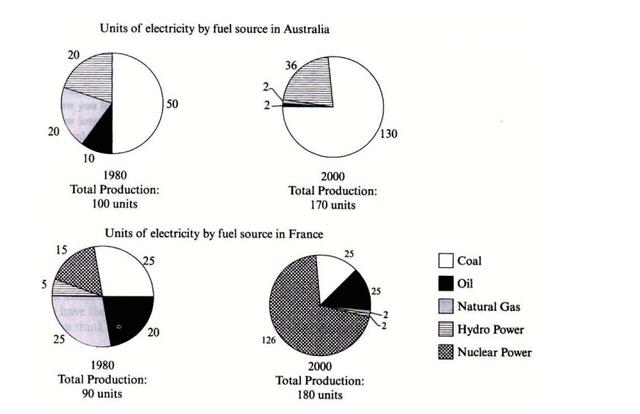
The pie charts compare the different energy sources used in the production of electricity in Australia and France during the years 1980 and 2000. As illustrated by the chart in 1980 coal accounted for the generation of half of the amount of electrical
power
in Australia Use synonyms
while
hydropower, natural gas and Linking Words
oil
were used in the production of the other half with 20%, 20% and 10% respectively. During the same period in France coal, Use synonyms
oil
and natural generated approximately the same percentage of electricity units around 20% each Use synonyms
whereas
nuclear and Linking Words
hydro
Correct your spelling
hydropower
power
was utilized only Use synonyms
in
20% cumulatively. After a 20-year period in Australia coal was the most popular fuel source increasing significantly from, 50% to 75%. Change preposition
apply
On the other hand
, we can see from the chart that Linking Words
hydro
Correct your spelling
hydropower
power
rose slightly to 36% and natural gas and Use synonyms
oil
experienced a considerable decline. In 2000 in Use synonyms
France
nuclear Add a comma
,France
power
became the most important source of electricity as it was responsible for the production of 75% of the entire amount of Use synonyms
elecricity
units. The percentage of electrical Correct your spelling
electricity
power
generated from coal and Use synonyms
oil
remained constant Use synonyms
while
natural gas and Linking Words
hydro
Correct your spelling
hydropower
power
were used in a very small amount.Use synonyms