
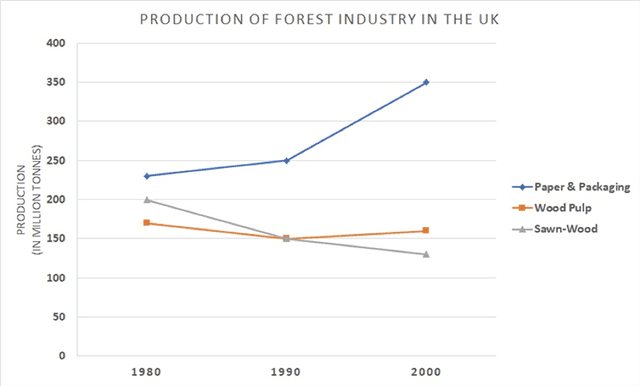
The line graph illustrates three productions of man-made products in wood that were manufactured specifically in the UK from 1980 to 2000.
overall
, Linking Words
paper
and packaging products gained the most income Use synonyms
whereas
the sawn-wood earned the least.
In 1980, the total weight production of Linking Words
paper
and packaging placed at approximately 240 Use synonyms
million
Use synonyms
tonnes
, Use synonyms
then
Linking Words
this
number slightly increased to 250 Linking Words
million
before having a significant rise to 350 Use synonyms
million
Use synonyms
tonnes
in 2000.
Use synonyms
Conversely
, Wood Pulp and Sawn-Wood saw different fashions as Linking Words
paper
and packaging. In 1980, the amount of production of two kinds of Use synonyms
paper
stayed at about 170 and exactly 200 Use synonyms
million
Use synonyms
tonnes
, respectively. After that, there were plummets in both productions in 1990 and shared the same low points at 150 Use synonyms
million
Use synonyms
tonnes
. Use synonyms
Finally
, Wood Pulp saw a minor increase to around 160 Linking Words
million
in 2000 Use synonyms
while
the Sawn-Wood observed a continuous downtrend in under 150 Linking Words
million
.Use synonyms