
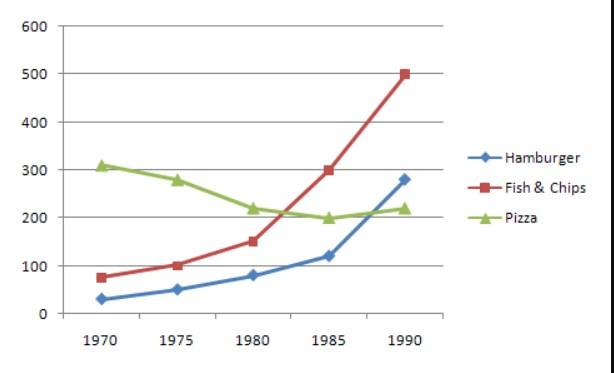
The illustration above provides the popularity of the digestion of junk food in the UK between the years 1970 to 1990.
Overall
, Linking Words
pizza
had the highest rating but declined over time.
During 1970 the most popular food was Use synonyms
pizza
coming in at 300 units consumed. Use synonyms
In addition
, hamburgers had the lowest in the chart at around 20. The following year , Linking Words
pizza
fell gradually to below 300. Use synonyms
However
, fish and chips had a slight growth reaching 100 exactly. By 1980 , Linking Words
pizza
fell to just above 200 , fish & chips to 150 and hamburgers rose to barely under 100. In 1985 not a lot changed except Use synonyms
pizza
started to stabilize . The beginning of 1990 was the most impactful year for all of the categories , Use synonyms
pizza
kept its trend at 200 , and hamburgers rocketed all the way to 280 doubling itself . Use synonyms
Finally
, fish and chips dramatically increased to 500 processed food eaten in 1990 by UK citizens.Linking Words