
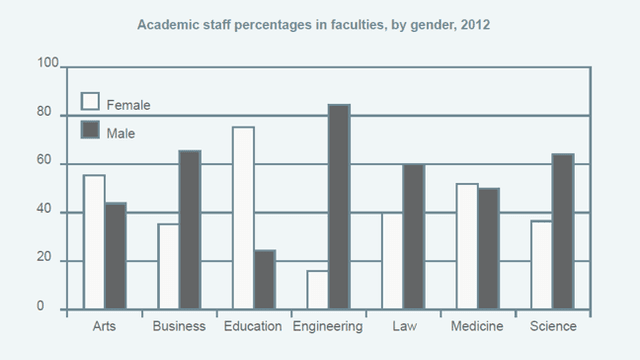
The graph presents data on the percentage of jobs occupied by men and women in a major university.
The blue column represents women, and the red column represents men.
To begin
with, I would like to focus your attention on two significant areas.
The first one, the majority of staff members in engineering are males with 85% with 18% for females. Linking Words
Therefore
, Linking Words
this
provides evidence that the faculty of engineering is male-dominant.
The second significant area is the faculty of education, which have 72% females and 25% males. An evaluation of Linking Words
this
data suggests that the education industry is female-dominant.
Linking Words
Furthermore
, the faculty of medicine has more women than men. Linking Words
However
, it has a close percentage with 50% females and 49% males
Which shows great competition.
Linking Words
Overall
, a general analysis shows that the faculties of business, engineering, law and science have more male employers , Linking Words
whereas
the faculties of arts, education, and medicine have more female employers.Linking Words