
Introduction
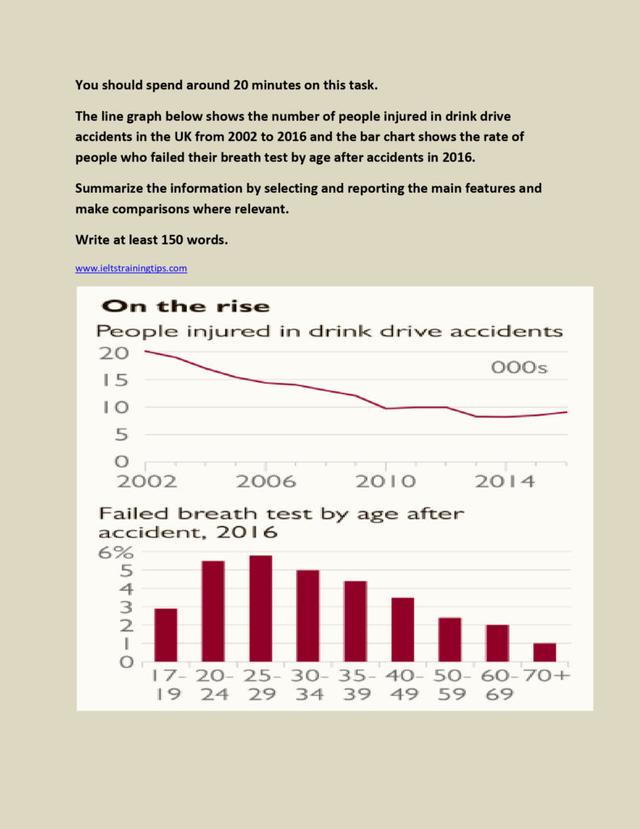
The line graph illustrates how many
people
were hurt Use synonyms
as a result
of driving Linking Words
while
drunk in the United Kingdom from 2002 to 2016 Linking Words
while
the bar chart depicts the percentage of casualties who did not pass the breathing test by age in 2016.
Overview.
In general, the United Kingdom recorded the highest Linking Words
number
of accident victims at the beginning of the period compared to the end. Use synonyms
On the other hand
, the Linking Words
number
of Use synonyms
people
who failed to breathe after the accident by age fluctuated in the period given.
Paragraph one
In 2002, 20 Use synonyms
people
were injured in the UK Use synonyms
as a result
of drunk driving. Linking Words
However
, Linking Words
this
Linking Words
number
declined moderately over the Use synonyms
years
. In 2006, the initial figure had dropped by 5 Use synonyms
people
, Use synonyms
therefore
, a record of 15 Linking Words
people
was made. Use synonyms
This
Linking Words
number
continued to decline smoothly until 2010 when 10 Use synonyms
people
were injured. Use synonyms
However
, a period of stability was experienced until 2012 when the figure remained at 10 Linking Words
people
and afterwards declined to 8 casualties in 2013. Between 2013 and 2016, the totals were constant again at 8 Use synonyms
people
before rising to about 9 individuals in 2016.
Paragraph 2
Regarding the Use synonyms
people
who failed to Breathe after encountering accidents in 2016, the highest percentage of Use synonyms
people
were aged between 25-29 Use synonyms
years
at about 5.9%. Those aged between 20-24 Use synonyms
years
and 30-34 Use synonyms
years
came close with around 5.5% and 5% respectively. A decline in the Use synonyms
number
of Use synonyms
people
who failed to breathe by age was reported whereby those aged between 40-49 Use synonyms
years
were approximately 3.5% Use synonyms
whereas
those aged 60-69 Linking Words
years
were around 2%. Those aged above 70 Use synonyms
years
accounted for the least with only 1% failure to breathe in 2016 after accidents.Use synonyms