
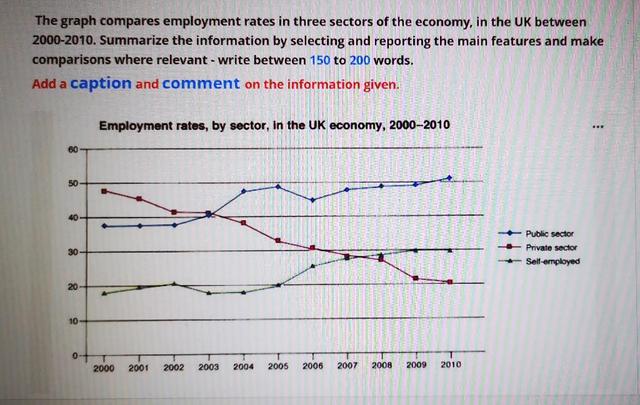
The graph shows the comparison of employment rates in three sectors of the economy in the UK, over a ten-year period between 2000 and 2010.
Overall
, what stands out from the graph is that there were gradual upward trends in the rate of both the Public Linking Words
Sector
and Self-employed, Use synonyms
while
the scale of the Private Linking Words
Sector
saw a considerable fall over the period in question. Another interesting point is that Private Use synonyms
Sector
was the most popular in 2000, but in 2010, the Public Use synonyms
Sector
hired more people than others.
Looking at the details, as regards the Public Use synonyms
Sector
, the rate started at 38 in 2000, the figure remained stable in the first two years, at which point it levelled off at just under 50 until 2006. Use synonyms
Then
there was a fluctuation over the next five years, finishing at around 51 in 2010. If we look at the Self-employed, the trend was similar. Linking Words
Hence
, increased marginally to approximately 20 in the first half of the decade, scale Linking Words
then
rose steadily, reaching 30, and hasn’t changed since 2009.
Linking Words
By contrast
, the rate of the Private Linking Words
Sector
went in the opposite direction. Use synonyms
To begin
, it started from about 50, after it dropped gradually for two years, Linking Words
then
the figure had stability for one year. Linking Words
However
, the decrease resumed and went from around 40 to 20 in 2010.Linking Words