
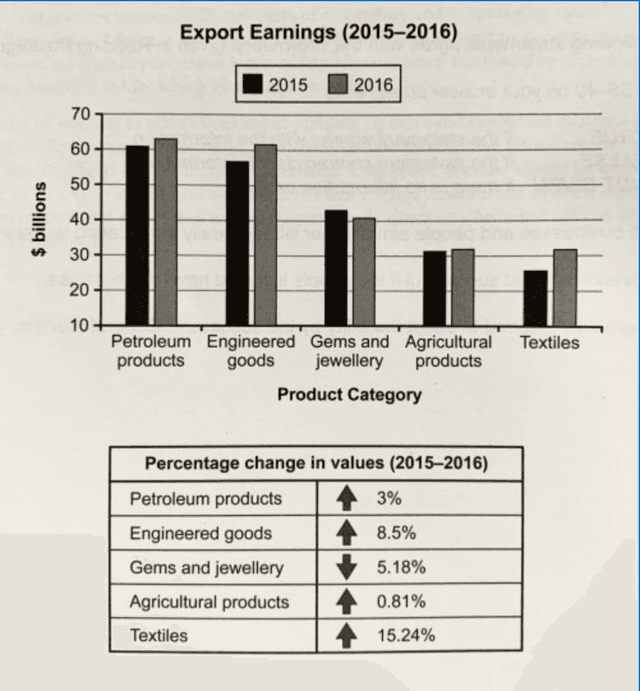
The bar chart depicts the income of a particular nation from five different exports from 2015 to 2016
while
the table gives information about the Linking Words
percentage
change in values of these commodities in the same period of time.
From the Use synonyms
overall
perspective, petroleum products contributed the most significant income for the nation and engineering goods has the highest values in two different years.
Linking Words
It is clear that
in 2015 and 2016 petroleum products became the most productive export activities consisting of $60 Linking Words
billion
and $62 Use synonyms
billion
, respectively. Use synonyms
Then
, it was followed by engineered goods which contributed $55 Linking Words
billion
and $60 Use synonyms
billion
in the two different years.
Use synonyms
According to
the given pictures, textiles, interestingly, were the highest in Linking Words
percentage
at 15,24%. Use synonyms
Following
Linking Words
this
was engineered goods at 8,5%. Linking Words
However
, Linking Words
although
petroleum became the highest, it just increased by 3% in value Linking Words
percentage
. Use synonyms
Moreover
, agricultural products had the least Linking Words
percentage
at 0,81%. Use synonyms
In contrast
, germs and jewellery had opposite directions with 5,15%.Linking Words