This line chart shows trends in terms of employment i the USA in millions and predictions for the future.

This line chart shows trends in terms of employment i the USA in millions and predictions for the future.
This
Change preposition
In this
show examples
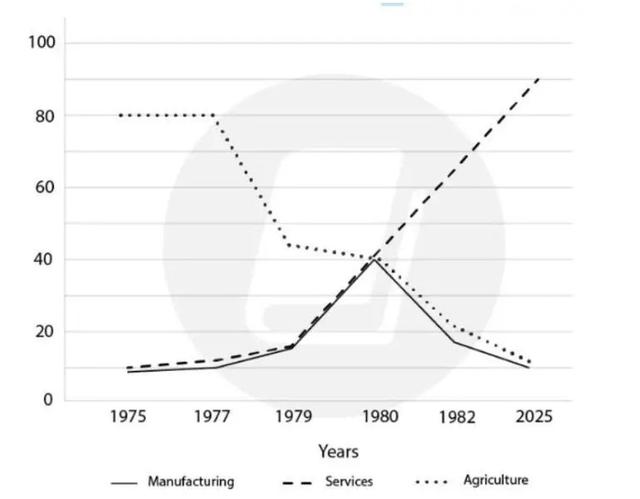
line chart we can see trends of employment in different things in the United States of America throughout the years in millions.
Over all
Correct your spelling
Overall
show examples
, we can see that during the
last
15 years, between the years 1975 and
2025
Add a comma
,2025
show examples
there has been some increment in the area of services and some decreasement in manufacturing and agriculture.
Firstly
, we can see that at
first
Add a comma
,first
show examples
the services were steady between 10 and 15 million but in 1979
it
Correct pronoun usage
they
show examples
went up sharply to end in 90. In the area of
manufacturing
Add a comma
,manufacturing
show examples
it was similar to services at
first,
in 1979 it went up and got to 40
however
in 1980 it dropped to 10 million in 2025.
Last
but not least, the one that had the most changes
Add the comma(s)
, in particular,
show examples
in particular
was agriculture. It started in 1975 with 80 million just to
plung
Correct your spelling
plunge
plug
to 50 in 1979, to finish up with 10 in 2025.
Submitted by patriciareyesfiguero on

Unauthorized use and/or duplication of this material without express and written permission from this site’s author and/or owner is strictly prohibited. Excerpts and links may be used, provided that full and clear credit is given to Writing9 with appropriate and specific direction to the original content.

Sentences: Add more complex sentences.
Linking words: Don't use the same linking words: "last".
Introduction: The introduction is missing.
Introduction: Change the first sentence in the introduction.
Introduction: The chart intro is missing.
Basic structure: Change the second paragraph.
Introduction: The chart intro is missing.
Vocabulary: Rephrase the word "trends" in your introduction.
Vocabulary: Only 4 basic words for charts were used.
Vocabulary: The word "went up" was used 2 times.
Vocabulary: Use several vocabularies to present the data in the second paragraph.
What to do next:
Look at other essays: