
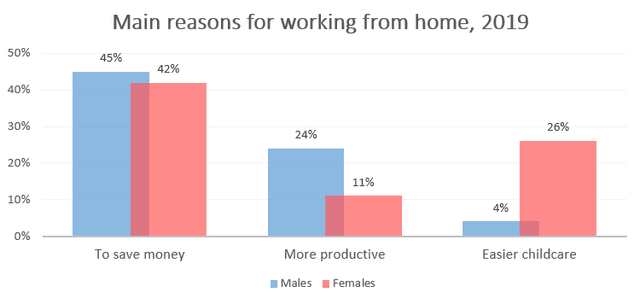
The diagrams give information on why people prefer to
work
from Use synonyms
home
and the hours between Use synonyms
men
and Use synonyms
women
who worked at Use synonyms
home
in the year 2019.
Use synonyms
Overall
, it can seem that the diagram shows three reasons why many people chose to Linking Words
work
online from Use synonyms
home
like saving Use synonyms
money
, having more productivity and having easier Use synonyms
childcare
. Use synonyms
In addition
, saving Linking Words
money
was the highest. Use synonyms
In contrast
, the lowest was easier Linking Words
childcare
.
Use synonyms
Firstly
, Linking Words
men
preferred to Use synonyms
work
online because they would save their Use synonyms
money
by 45 per Use synonyms
cent
.Followed by more productivity was 24 per Use synonyms
cent
and easier Use synonyms
childcare
was 4 per Use synonyms
cent
respectively.
Use synonyms
On the other hand
, Linking Words
women
enjoy working Use synonyms
work
at Use synonyms
home
because of saving Use synonyms
money
by 42 per Use synonyms
cent
.Followed by easier Use synonyms
childcare
was 26 per Use synonyms
cent
and more productivity was 11 per Use synonyms
cent
respectively.
Use synonyms
Moreover
, the diagram provides data on Linking Words
women
who preferred to have easier Use synonyms
childcare
than Use synonyms
men
. But, Use synonyms
men
prefer to Use synonyms
work
from Use synonyms
home
because more productive than Use synonyms
women
.Use synonyms