
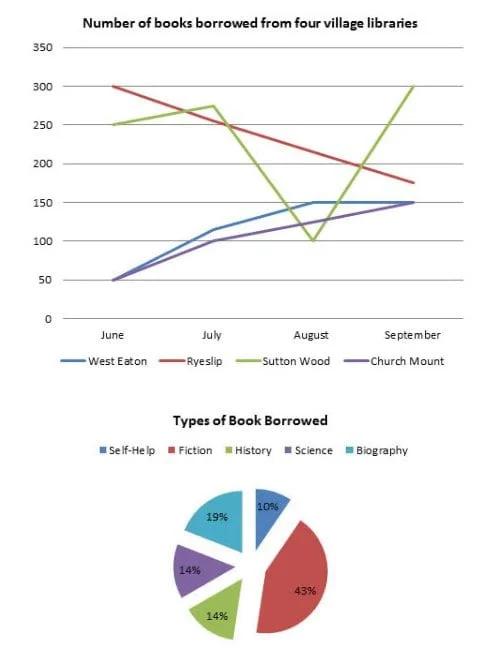
The line graph and pie chart depict, in the year 2014 in four wide months, the number and type of books that have been borrowed from 4 village libraries.
From an
overall
perspective, the aeons taken into consideration are 4, namely June, July, August and September; whilst the type of books that are existing in Linking Words
this
task are: History, Science and Biography. Linking Words
Additionally
, the diagram illustrates the name of the villages Libraries, or rather West Eaton, Ryeslip, Sutton Wood and Church Mount.
Linking Words
To begin
with the month of June, the library of Ryeslip reaches the highest number of 300 to end up with a drastic decrease 4 months later; Linking Words
While
for the case of S.wood, its process is a continuity of up and down. Following the next 60 days is Linking Words
also
evident the amendment of West Eaton and Church Mount, which present quite similar processes, with a slight difference during the measure of time of August. Linking Words
On the other hand
, related to the fees for the types of books, it's possible to see its highest fraction of 43% for fiction, 19% for Biography, 14% for both Science and History and the lowest of 10% for self-help.
Linking Words
To sum up
, with what has already been mentioned it's relevant to highlight that over the 16 weeks, whole rates are going always down.Linking Words