
This
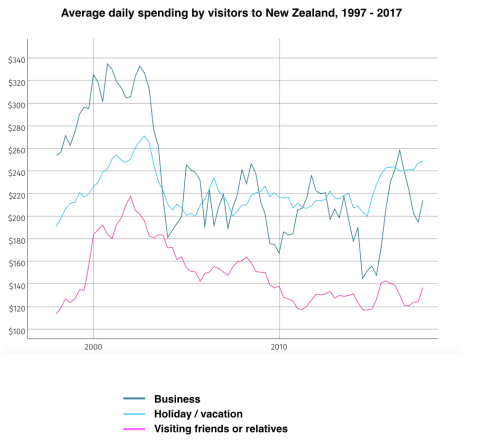
chart depicts the mean value in daily expenditure by tourists to New Zealand, spanning two decades, from 1997 to 2017. The line graph is Linking Words
further
divided to show the different Linking Words
categories
of visitors, from those travelling for Use synonyms
business
, for leisure or for visiting friends and relatives.
The trend is similar for all three Use synonyms
categories
- there is a general increase seen Use synonyms
initially
from 1997-2003, which Linking Words
then
drops and remains steady until 2017. There are, of course, fluctuations seen, but the general trend seems to plateau.
Between 1997 and 2003, there is a distinct difference between the groups with the most Linking Words
expense
carried out by those in New Zealand on Use synonyms
business
, whilst the least is the group visiting family. After 2003, there is a sharp decrease in Use synonyms
business
Use synonyms
Use synonyms
expense
until it stabilises with the group there on holiday. Fix the agreement mistake
expenses
However
, there is no overlap seen with the category visiting friends as that group is continuously spending less.
Those there on Linking Words
business
Use synonyms
inititally
spend around $300 per Correct your spelling
initially
day
, but after 2003 Use synonyms
this
dropped to around $200 per Linking Words
day
- a decrease of $100 per Use synonyms
day
. Use synonyms
Linking Words
Similarly
the expenditure of the other two Add a comma
,Similarly
categories
Use synonyms
also
dropped, but not to the extent of the Linking Words
business
travellers. The tourists spent around $40 less per Use synonyms
day
and those there Use synonyms
visitng
family spent approximately $60 less per Correct your spelling
visiting
day
.
Interestingly, the only category to have dropped below the Use synonyms
expense
recorded in 1997 is the people who travelled to New Zealand on Use synonyms
business
- the other two groups remained consistent with their 1997 Use synonyms
Use synonyms
expense
.
Fix the agreement mistake
expenses
Overall
there is a decrease in all three Linking Words
categories
after 2003, which may have been Use synonyms
due to
less travelling which means less Linking Words
expense
; or maybe Use synonyms
due to
an inflation in price from 1997 to 2003.Linking Words