
The purpose of
this
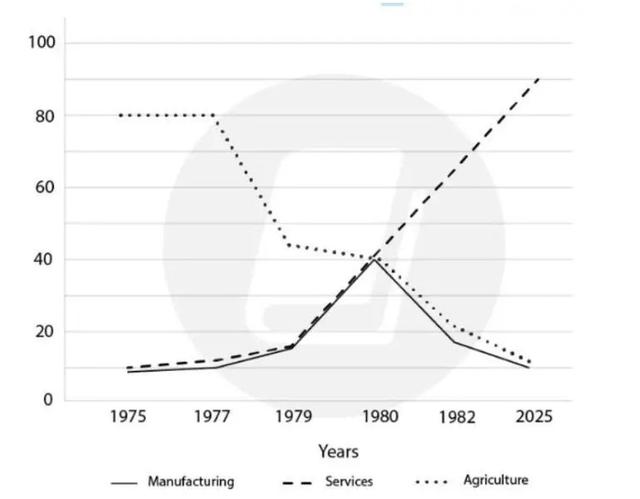
report is to provide data pertaining to the employment trends in the US as reported from 1975 to 2023 and predicted for 2025. The primary thrust of Linking Words
this
line chart is that the dominant trend in relation to services was one of growth, Linking Words
whereas
agriculture experienced a decline. The trend of manufacturing should Linking Words
also
be pointed out, where it Linking Words
initially
increased but Linking Words
then
slowly lost prominence.
Linking Words
This
analysis will commence with the feature where the prevalent pattern was one of the downward values.
In the first two years of the report, employment in the farming industry remained constant at eighty Linking Words
million
people. Use synonyms
However
, from 1977 onwards, the negative rate of change began. As it is standing, the figure for Linking Words
this
sector is roughly twelve Linking Words
million
. Use synonyms
Nevertheless
, is it expected to continue to diminish in the next few years.
Attention shall now be drawn to the feature which had predominantly undergone an upward movement. In the first four years displayed in the chart, the service sector saw a minimal improvement of about five Linking Words
million
people. Use synonyms
Nonetheless
, from 1979 to the present day, Linking Words
this
area has been enjoying tangible and constant growth, overtaking both manufacturing and agriculture in 1980. It is forecasted that the number will reach one hundred Linking Words
million
by 2025.
Regarding the final feature, manufacturing experienced similar growth patterns as services up to 1980, when it suddenly stopped and began to slide down. The predicted figure for Use synonyms
this
sector by 2025 is ten Linking Words
million
people, which is almost equal to that of the initial year. Use synonyms
Finally
, it is worth mentioning that the peak value for manufacturing was forty Linking Words
million
, achieved in 1980.Use synonyms