
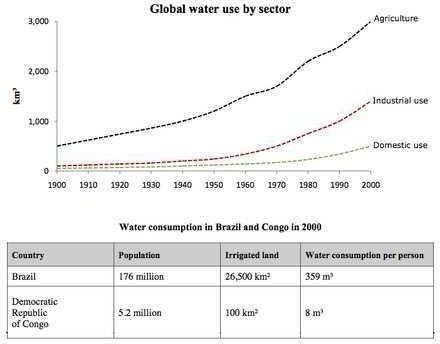
Depicted in the two graphs is the global totalling of
water
usage in different areas Use synonyms
as well as
the Linking Words
consumption
amounts in Brazil and Congo in 2000.
Use synonyms
Overall
, it can be inferred that agriculture took up the largest share of Linking Words
water
amongst the three sectors and domestic purposes the least with a rather significant difference between Brazil and Congo in terms of Use synonyms
water
Use synonyms
consumption
.
Throughout the time period, the agricultural need for Use synonyms
water
was of uttermost importance, registering a dramatical figure increase from about 500 km3 to approximately 3,000 km3 in 2000, particularly more pronounced in the second half of the century. The amount of Use synonyms
water
consumed in the industrial and domestic sectors Use synonyms
also
witnessed a gradual upward shift, but Linking Words
consumption
numbers were rather dismissible until mid-century. From 1950 onwards, industrial use surged steadily to over 1,000 km3, Use synonyms
while
domestic use rose more slowly to only 300 km3, both far below the levels of Linking Words
consumption
by agriculture.
The given table illustrates the quantities of Use synonyms
water
used in different areas of the world.
Brazil has much more irrigated land with 26,500 km2 for its population of 176 million and Use synonyms
water
Use synonyms
consumption
per person being 359 m3. Congo, Use synonyms
on the other hand
, is much less populous with only 5.2 million people and possesses a mere 100 km2 of irrigated land and a person here would require only 8m3 of Linking Words
water
for their usage.Use synonyms