
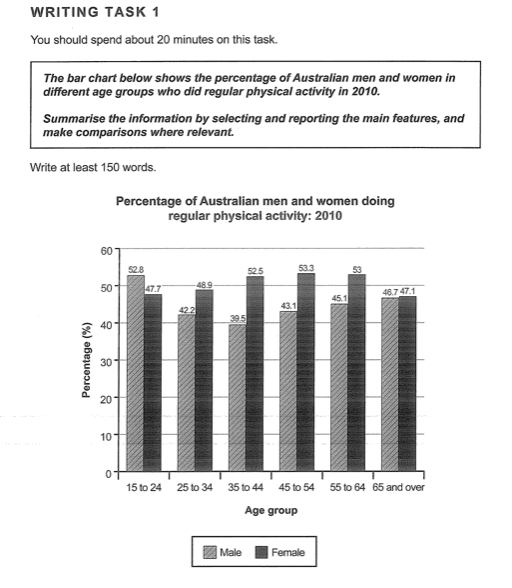
The bar chart illustrates the different information about physical activities between men and women of the same age in Australia in the year 2010
Overall
, the female do were activities than males of the same age Linking Words
except
the group 15-24 .Add the preposition
forexcept
In addition
, the elder has the same ratio in performing the exercises.
Linking Words
Initially
, women's rate of doing regular activity was 47.7 by 15 to 24. It rose to almost 1% in 25 to 34.Linking Words
However
. It gradually increased until it reached 53 in 55-64. At 65 and over it hitting a low point of about 47.1.
Linking Words
On the other hand
, the male being was 52.8 with age 15-24 it was the higher point in the activity the men, after that it decreased steadily to 42.2 in 25-34. Linking Words
Following
Linking Words
this
, it continued downward until reached 39.5 between 35-44 . Linking Words
Then
jumped up to 43.1 in 55-64 . Linking Words
At the end
of the Linking Words
,
period it was the same rate Remove the comma
apply
with
femaleChange preposition
for