The first chart below shows the percentages of women and men in a country involved in some kinds (cooking, cleaning, pet caring and repairing the house). The second chart show the amount of time each gender spent on each task per day. Summarize the information by selecting and reporting the main features, and make comparisons where relevant.

The first chart below shows the percentages of women and men in a country involved in some kinds (cooking, cleaning, pet caring and repairing the house). The second chart show the amount of time each gender spent on each task per day. Summarize the information by selecting and reporting the main features, and make comparisons where relevant.
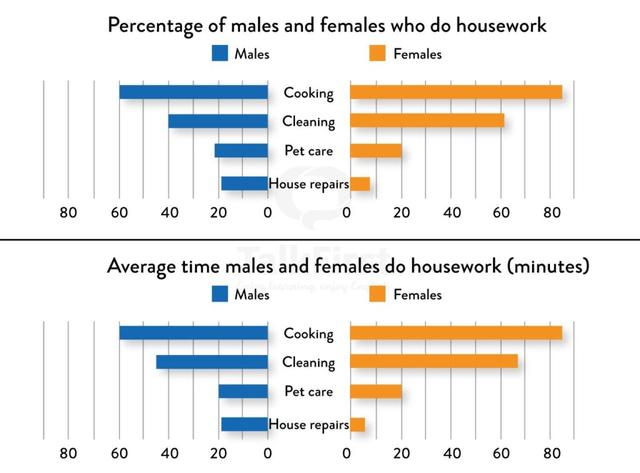
The two figures illustrate the proportion of men and women and the time they involve with different types of housework per day in a country.
Overall
, the majority of the time and people is spent on cooking and cleaning
while
pet care and house repairs are a small proportion. The majority is cooking, which comprises 60% of males and over 80% of females.
Moreover
,
this
takes up an hour and 1 and a half hours respectively for each sex. Followed by cleaning which is spent 42 and 69 minutes respectively, and 40% of males and 61% of females do
this
job. After
that is
pet care which consists of around 20% for each gender and
also
takes up 20 minutes of their day.
Finally
, repairing the house has the least participants, which is 19% and 9% respectively, and
also
has the least time spent, which is 20 and 5 minutes.
Submitted by cathyngo1512 on

Unauthorized use and/or duplication of this material without express and written permission from this site’s author and/or owner is strictly prohibited. Excerpts and links may be used, provided that full and clear credit is given to Writing9 with appropriate and specific direction to the original content.

Linking words: Don't use the same linking words: "also".
Introduction: The introduction is missing.
Introduction: The chart intro is missing.
Basic structure: Change the third paragraph.
Introduction: The chart intro is missing.
Vocabulary: Only 4 basic words for charts were used.
Vocabulary: The word "proportion" was used 2 times.
Vocabulary: Use several vocabularies to present the data in the third paragraph.
What to do next:
Look at other essays: