
The
graph
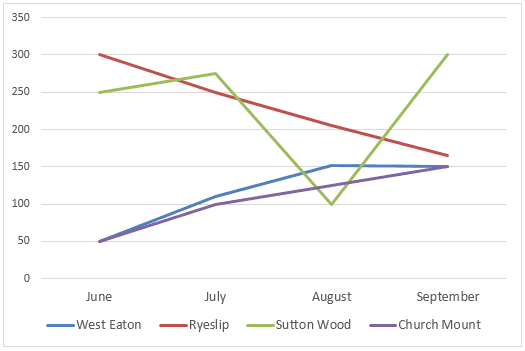
illustrates a fluctuation in Use synonyms
books
borrowed in the libraries in four different villages from Use synonyms
June
to Use synonyms
September
2014. Use synonyms
Overall
, there is a dramatic rise in the number of Linking Words
books
that Sutton Wood lent. The increase is more gradual in both Church Mount and West Eaton Use synonyms
whereas
Ryselip is the only library which had a sharp decline in the total number of borrowed Linking Words
books
.
Use synonyms
According to
the Linking Words
graph
, the most significant fluctuation occurred in the figure of Sutton Wood with an incredible gap between the highest and the lowest. After a slight increase from 250 in Use synonyms
June
to 280 in July, the figure experienced a sudden drop in August when only 100 Use synonyms
books
were borrowed. The number of Use synonyms
books
borrowed in Sutton Wood skyrocketed to reach the top at 300 in Use synonyms
September
. Regardless of the most Use synonyms
books
borrowed in Ryeslip in Use synonyms
June
, there was a constant decrease to hit the bottom at 160 in Use synonyms
September
.
Both the graphs for West Eaton and Church Mount show an upward trend Use synonyms
although
people borrowed relatively fewer Linking Words
books
than the other two. Starting at the same level at 50 in Use synonyms
June
, the gap between West Eaton and Church Mount became wider in August when 150 Use synonyms
books
were borrowed in the former Use synonyms
while
130 Linking Words
books
in the latter. They followed a different path as the former Use synonyms
graph
remained stable Use synonyms
in contrast
to the latter Linking Words
graph
which kept rising and reached 100 in Use synonyms
September
.Use synonyms