
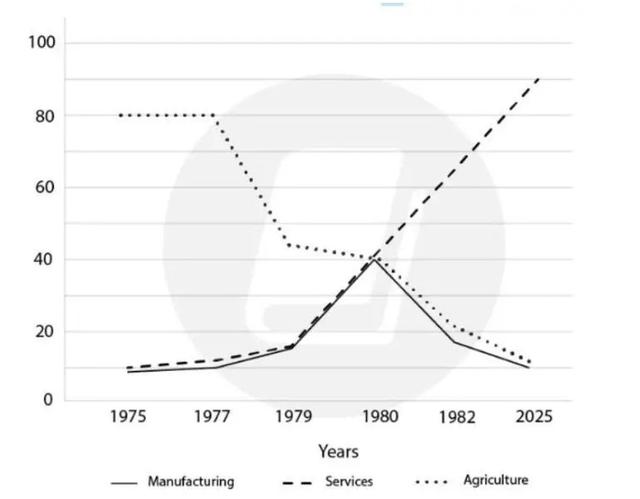
The line chart illustrates information about the number of employed people in three different sections in the United States since the year 1975 and anticipation for 2025.
Overall
, it can be seen that the service section has seen an upward trend in the trend and it will be continued to go up Linking Words
while
agriculture has witnessed a downward one over the whole period.
Regarding the agriculture and service segments, as can be seen, both of them experienced two opposite trends. Linking Words
In other words
, at the beginning of the period, the population of individuals who worked in agriculture was 80 Linking Words
million
Use synonyms
then
it decreased significantly in the years between 1977 to 1979 to about 45 Linking Words
million
. Use synonyms
Subsequently
, with a slight decline in 1980. Linking Words
Moreover
, it is predicted that Linking Words
this
downfall trend will be continued to about 10 Linking Words
million
in 2025. Use synonyms
On the other hand
, the number of employed people in service was 10 Linking Words
million
in 1975 which increased gradually until the year 1979 Use synonyms
then
, soared until now and it will continue increasing in the future as well.
Turning to the manufacturing section, it witnessed a fluctuation over the period it had 10 Linking Words
million
people working in plants in the year 1975 Use synonyms
then
increased to 40million in 1980but Linking Words
then
decreased substantially to the same number as its beginning (10 Linking Words
million
).Use synonyms