
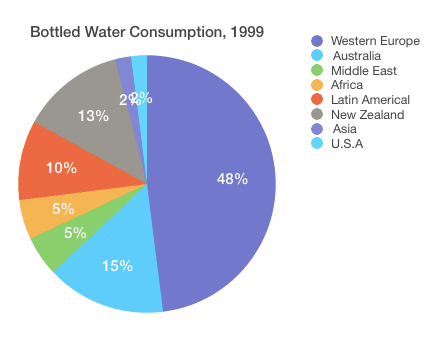
The pie chart gives information about the percentage of bottled
water
usage in different areas of the world in 1999 and the bar chart illustrates how it grew in 2001.
Use synonyms
Overall
, most part of bottled Linking Words
water
was consumed in Use synonyms
Asia
at the beginning of the period Use synonyms
while
Western Linking Words
Europe
and the USA were the regions with less bottled Use synonyms
water
usage. Use synonyms
At the end
of the period, most of the given regions (Linking Words
Asia
, the Middle East, Africa, Latin America, New Zealand, Australia and the USA) experienced significant growth in terms of drinking bottled Use synonyms
water
except Western Use synonyms
Europe
.
Middle East and Africa were few bottled Use synonyms
water
consumers with only 5% each in 1999 but in 2001 the rate of bottled Use synonyms
water
intake increased by nearly 10 % in both areas. A similar situation occurred in Latin America and New Zealand where bottled Use synonyms
water
usage was 10% and 13%, respectively in 1999. Both Latin America and New Zealand experienced the same level of growth in 2001 which was about 13% each.
Use synonyms
While
Linking Words
Asia
was the most bottled Use synonyms
water
consumer at the beginning of the period with 48%, Western Use synonyms
Europe
and the US were the least bottled Use synonyms
water
users among given regions. In 2001 Use synonyms
Asia
kept its leadership in terms of bottled Use synonyms
water
intake with an increase of 14% at the same time Western Use synonyms
Europe
experienced only around 3% growth. Use synonyms
In contrast
to Western Linking Words
Europe
, in the US there was a significant increase (nearly 8%) in the rate of bottled Use synonyms
water
consumption in 2001.Use synonyms