
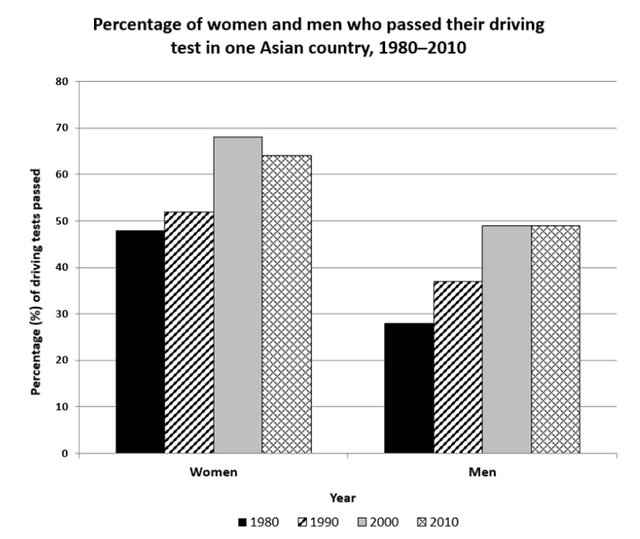
The bar graph compares the passing rates of driving license tests between males and females belonging to a country in Asia from 1980 to 2010.
Overall
, the highest percentage of adults who succeeded in the driving test was women Linking Words
while
men accounted for a lower proportion of the pass percentages. Linking Words
However
, both the graphs have experienced a rising trend over the years.
On the one hand, in 1980, pass rates for females started at less than half, which Linking Words
then
rose to a peak of almost two-thirds in 2000. Linking Words
After
Linking Words
this
, the trend experienced a slight decline to about three-fifths.
Linking Words
On the other hand
, success rates amongst males were about one-fourths in 1980. The graphLinking Words
,
Remove the comma
apply
then
increased steadily to 50% in 2000 at which point it peaked and was stagnant for 10 years. In general, women had higher pass proportions throughout the period compared to men, with a difference of about 20% maintained throughout the 30-year period.Linking Words