The bar chart below shows the percentage of people who ate five portions of fruit and vegetables per day in the UK from 2001 to 2008.

The bar chart below shows the percentage of people who ate five portions of fruit and vegetables per day in the UK from 2001 to 2008.
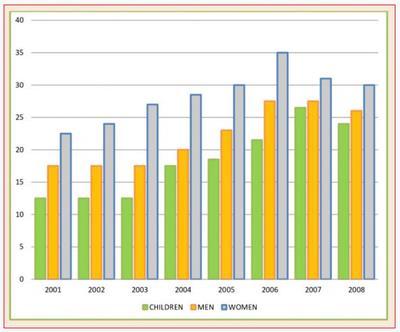
As we see in the bar chart, we have three types of People Who ate fruits and vegetables in the Past
Years
.  In 2001, they started at a low level, and as the
years
  passed, it increased.  As for men, in the first three
years
their eating average is almost level out, and in the following
years
, it gradually climbs except for the
last
year it
drop
Correct subject-verb agreement
drops
show examples
.  With regard to women, it
going
Wrong verb form
went
show examples
up in the first six
years
, and in the
last
two
years
, it
reduce
Wrong verb form
reduced
show examples
.
Finally
, children began their early
years
at a steady Yate and it increased from 2004 to 2007 but in the
last
Your it decreased Slightly.  In the
end
Add a comma
end,
show examples
we conclude that women at the most
in
Change preposition
apply
show examples
eat all
years
, followed
men
Change preposition
by men
show examples
and
then
children, women are
also
more careful than men and children in eating fruits and vegetables, as well the rate Soat for everyone in all
years
.
Submitted by Ethar Ali  on

Unauthorized use and/or duplication of this material without express and written permission from this site’s author and/or owner is strictly prohibited. Excerpts and links may be used, provided that full and clear credit is given to Writing9 with appropriate and specific direction to the original content.

Sentences: Add more complex sentences.
Linking words: Don't use the same linking words: "last".
Introduction: The introduction is missing.
Introduction: Change the first sentence in the introduction.
Introduction: The chart intro is missing.
Basic structure: Use less body paragraphs.
Basic structure: Change the second paragraph.
Basic structure: Change the sixth paragraph.
Introduction: The chart intro is missing.
Vocabulary: Replace the words years with synonyms.
Vocabulary: The word "increased" was used 2 times.
Vocabulary: Use several vocabularies to present the data in the second paragraph.
Vocabulary: Use several vocabularies to present the data in the seventh paragraph.
Topic Vocabulary:
  • Trend analysis
  • Significant fluctuation
  • Dietary habits
  • Public health campaign
  • Demographic breakdown
  • Socio-economic status
  • Predictive suggestions
  • Consumption rates
  • Dietary guidelines
  • Technological advancements
What to do next:
Look at other essays: