
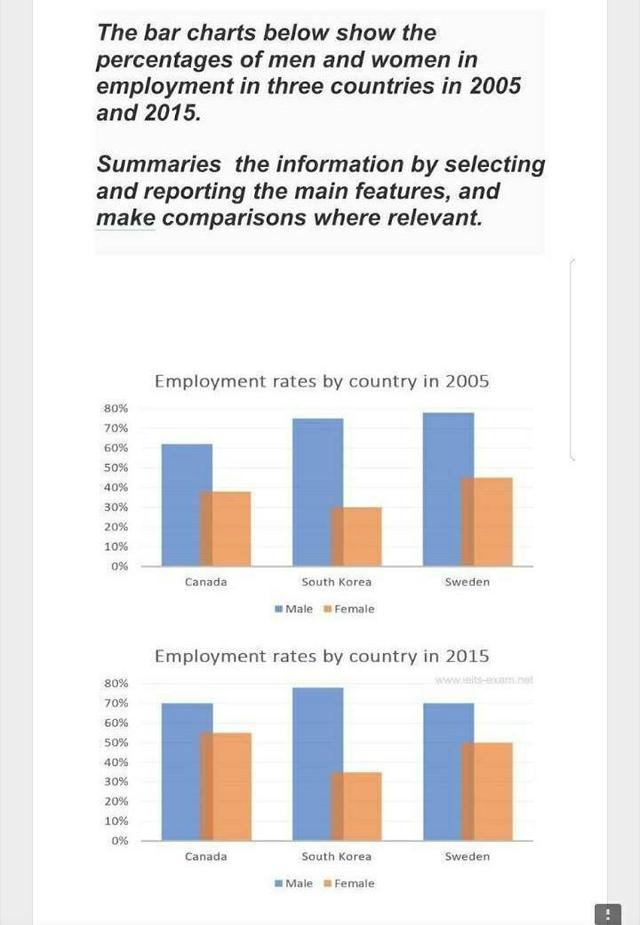
The chart illustrates the percentages of both genders working in three nations
such
as WW: namely Australia, Japan and Ireland from 2005 to 2015, a period of ten years. Linking Words
Overall
, there is a significant increase in the total Linking Words
percentages
of women in the Fix the agreement mistake
percentage
workforces
and a slight rise in the number of male employees.
As it is presented in the bar chart, the headcount number of male workers was greater than the number of female workers. Japan had the highest rate of men in the workforce, about 75% in 2005, and increased 3% in 2015 Fix the agreement mistake
workforce
while
the lowest is in Australia, where it was just over 60% in 2005 and 70% in 2015, equal with Ireland.
In all of the nations studied throughout the two years, males outnumbered females in the Linking Words
labor
force. In 2005, it was below 50% everywhere, but by 2015, the statistics had improved. In 2005, the percentage of women working in Ireland was the highest, accounting for roughly 44%, and it increased significantly by 6% in 2015. Change the spelling
labour
On the contrary
, the proportion of women working in Japan was the lowest, at roughly 30% in 2005 and rose to 34% in a period of ten years. Linking Words
On the other hand
, the Linking Words
percentages
of females working in Australia climbed dramatically from 38% to over 55%.Fix the agreement mistake
percentage