
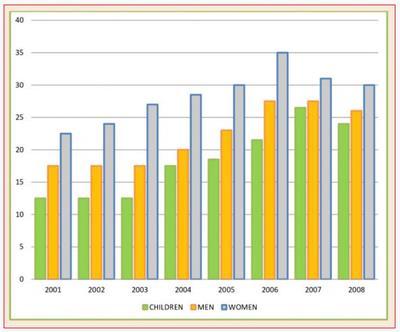
The diagram demonstrates how many British people consumed a portion of 5 vegetables and fruits each day between 2001 and 2008.
Overall
, Linking Words
it is clear that
Linking Words
while
Linking Words
women
had the most consumption of greeneries each year, the count was the least for youngsters.
Focusing on the first three years, the amount of vegetables and fruit children and men had showed no difference with a portion of almost 12.5 and 27.5, respectively. Use synonyms
On the other hand
, the same figure for Linking Words
women
rose dramatically from 22.5% to about 27% of usage on a daily basis.
Moving on to 2004 to 2008, all three of the subjects Use synonyms
initially
saw an increase with a following decline by the Linking Words
last
year. With Children and men's vegetable use being lower than that of Linking Words
women
's throughout the years, the former rose from around 17% to 24% and the latter saw an increase of about 6%. In terms of Use synonyms
women
, their slight change was Use synonyms
roundly
2%.Rephrase
around