
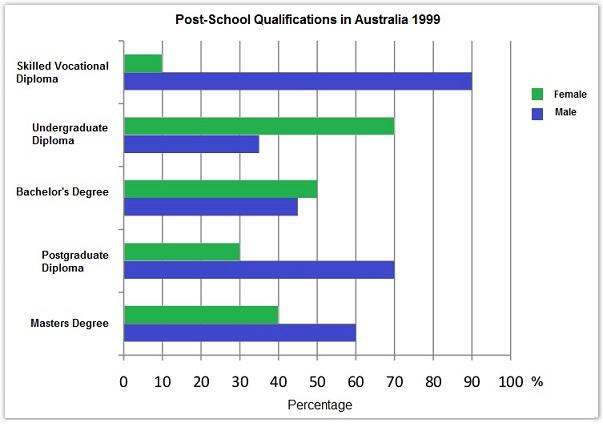
The bar chart depicts various levels of post-school qualifications in Australia and the percentage of
men
and Use synonyms
women
who held them in 1999.
Use synonyms
Overall
, it is noticeable that Linking Words
Correct article usage
the proportions
proportions
of Fix the agreement mistake
proportion
men
was higher than Use synonyms
women
throughout the period. Use synonyms
Moreover
, Linking Words
skilled
vocational Add an article
the skilled
Use synonyms
diploma
obtained the largest percentage of Fix the agreement mistake
diplomas
men
, Use synonyms
whereas
Linking Words
undergraduate
Correct article usage
the undergraduate
Use synonyms
diploma
lowest. In terms of Fix the agreement mistake
diplomas
female
, Fix the agreement mistake
females
also
undergraduate Linking Words
diploma
had the highest proportion of Use synonyms
women
, Use synonyms
while
Linking Words
skilled
vocational Correct article usage
the skilled
Use synonyms
diploma
smallest over the period in question.
Fix the agreement mistake
diplomas
To begin
with Linking Words
female
, Fix the agreement mistake
females
masters
Change noun form
master's
degree
accounted for 40 % which is 4 times higher than skilled vocational Fix the agreement mistake
degrees
Use synonyms
diploma
(10%). Fix the agreement mistake
diplomas
Therefore
, Linking Words
bachelor's
degree obtained 50 % which on 20 % higher than Correct article usage
a bachelor's
postgraduate
Correct article usage
a postgraduate
diploma
(30%). Use synonyms
Consequently
, Linking Words
undergraduate
Add an article
the undergraduate
an undergraduate
diploma
was the most popular among Use synonyms
women
.
With regards to Use synonyms
men
, there was negligible difference between Use synonyms
Add an article
a masters
masters
degree and postgraduate Change noun form
master's
diploma
, namely 60 and 70 %. The rate of Use synonyms
skilled
vocational Add an article
the skilled
Use synonyms
diploma
was almost 90 %, Fix the agreement mistake
diplomas
whereas
Linking Words
undergrduate
Correct your spelling
undergraduate
Use synonyms
diploma
Fix the agreement mistake
diplomas
only
34 %.Add a missing verb
were only