
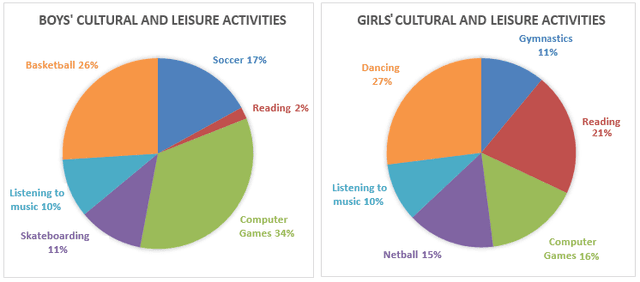
The carts illustrate the percentages of children's co-curricular activities by gender. All the values are shown in percentages.
Overall
, most the the Linking Words
boys
are interested in playing basketball and Use synonyms
computer
Use synonyms
games
, but the Use synonyms
girls
to dancing, Use synonyms
computer
Use synonyms
games
& and netball. Use synonyms
Furthermore
, some activities are quite common for both Linking Words
boys
and Use synonyms
girls
.
Use synonyms
Firstly
, 34% of Linking Words
boys
like to play Use synonyms
computer
Use synonyms
games
which shows the highest value. Use synonyms
While
Linking Words
,
basketball is showing 26% which is the second highest. Remove the comma
apply
In addition
, reading activity catches only 2% of Linking Words
boys
. In total, 60% of Use synonyms
boys
are attracted to Use synonyms
computer
Use synonyms
games
and basketball.
Use synonyms
On the other hand
, around 27% of Linking Words
girls
keep busy with dancing, but 16% to Use synonyms
computer
Use synonyms
games
which is a common activity between Use synonyms
boys
and Use synonyms
girls
. Use synonyms
Additionally
, only 11% of females go to gymnastics which is the lowest value in the chart.
Linking Words
However
, The same percentages of males and females are listening to music, which is 10 in value. Linking Words
Moreover
, reading is Linking Words
also
a common activity, but Linking Words
girls
like that much more than Use synonyms
boys
which is nearly 11 times in percentage.Use synonyms