
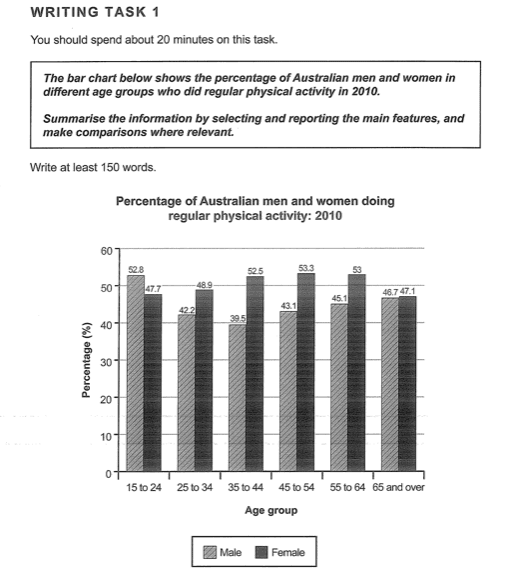
The given graph presents the allotment of Australian men and females of various ages who did continuous exercise in the year 2010.
Overall
the Linking Words
guy's
part has decreased over the year Change noun form
guys'
while
the women's area gradually increased by a small, minority but provided categories shares have fluctuated throughout the time. Linking Words
However
, the ladies' section depicted a notable difference. Linking Words
Whereas
only the youngsters did less strenuous activity than their older counterparts.
It is evident from the chart that the portion ranging from ages 1 to 52.5 has fairly dropped Linking Words
also
the lowest cut observed is in 39 aged males.
Linking Words
Consequently
, it steadily rose in the 43- 46-year-old fellow's group. Linking Words
Although
, the female's data gently peaked from 47.7 to 52.6 in the aged ladies batch. Linking Words
Nevertheless
, it partly dipped at Linking Words
last
.
In comparison to bloke, lasses fraction escalated even though it remained unchanged in order to report no significant reduction. Linking Words
Moreover
, it negligibly progressed.Linking Words