
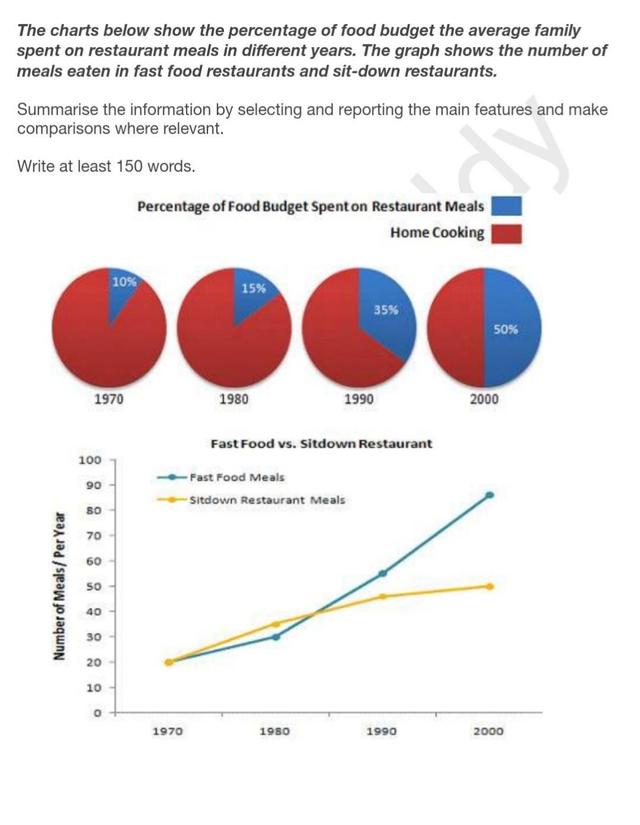
The restaurant, composed 90 to 10.
chart
shows information about the number percentages in the food budget spent on restaurant Use synonyms
meals
and Use synonyms
home
cooking Use synonyms
while
the graph shows information about the number of Linking Words
meals
eaten in sit-down Use synonyms
restaurants
and fast-food Use synonyms
restaurants
, and both the Use synonyms
chart
and graph are in 1970, 1980, 1990, and 2000. As can be seen from the Use synonyms
chart
, it is obvious that the percentage of Use synonyms
home
cooking decreased Use synonyms
whereas
the percentage of Linking Words
restaurants
increased.
In the graph, there was an increase in both fast food and sit-down Use synonyms
restaurants
; Use synonyms
however
, Linking Words
while
sit-down restaurant Linking Words
meals
increased gradually, from 20 in 1970 to 50 in 2000, fast food Use synonyms
meals
rose dramatically, starting at 20 and reaching a peak at 80 in the Use synonyms
last
year.
In the Linking Words
chart
, in 1970, Use synonyms
home
cooking was nine times as much asUse synonyms
Add an article
a
Nevertheless
, the figure for Linking Words
home
cooking dropped slowly year on year and in 2000 both figures were the same amount with 50.Use synonyms