The charts below show the percentage of water used for different purposes in six areas of the world. Summarise the information by selecting and reporting the main features, and make comparisons where relevant.

The charts below show the percentage of water used for different purposes in 

six areas of the world. 

Summarise the information by selecting and reporting the main features, and 

make comparisons where relevant.
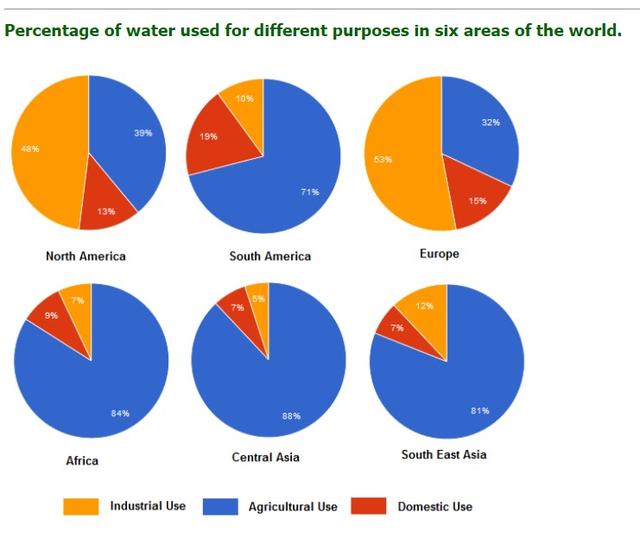
The Pie charts shown below illustrate the data on
water
consumption in six regions of the world for 3 different purposes. In the below Charts usage of
water
is analyzed by dividing it into three main categories. First for the agriculture, Which seems to be highest in some areas. Second is industrial usage of
water
and the third one is domestic use which is nothing but the people use for general purposes.The consumption by industrial area in Europe and North USA is comparatively higher than the other 4 continents which is 53 % and 48%,
Whereas
South America, Africa, Central, and Southeast
Asia
used 10%,7%5%, and 12% respectively. The second category is agriculture use, Where Central
Asia
is at number 1 with 88%. Africa and southeast
Asia
are second and third with 84 and 81 percent. North United States was fourth with 74 % and at the least, North America and Europe consumed 39 and 32 % of the
water
. For domestic in all 6 parts, Relatively less
water
is used as compared to the other two categories. The two American continents used a total of 23%. Europe alone 15% and both parts of
Asia
utilized equally which is 9% each and in the end, Africa used 9 % for general needs.
Submitted by raahulspatil.1 on

Unauthorized use and/or duplication of this material without express and written permission from this site’s author and/or owner is strictly prohibited. Excerpts and links may be used, provided that full and clear credit is given to Writing9 with appropriate and specific direction to the original content.

Linking words: Add more linking words.
Basic structure: Use less body paragraphs.
Basic structure: Change the third paragraph.
Basic structure: Change the fourth paragraph.
Basic structure: Change the sixth paragraph.
Vocabulary: Replace the words water, asia with synonyms.
Vocabulary: Only 4 basic words for charts were used.
Vocabulary: The word "charts" was used 2 times.
Vocabulary: Use several vocabularies to present the data in the third paragraph.
Vocabulary: Use several vocabularies to present the data in the fourth paragraph.
Vocabulary: Use several vocabularies to present the data in the sixth paragraph.
Topic Vocabulary:
  • water consumption
  • agricultural, industrial, domestic
  • usage patterns
  • developed vs developing regions
  • irrigation systems
  • climate factors
  • percentage breakdown
  • water management
  • sustainability
  • residential water use
  • efficiency
  • charts comparison
  • water-intensive
  • water scarcity
  • resource allocation
  • desalination
What to do next:
Look at other essays: