
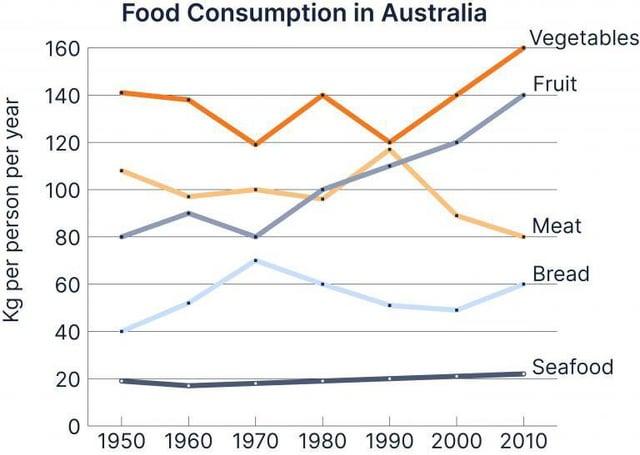
The line graph provides information about the
food
Use synonyms
consumption
per individual per Use synonyms
kg
, Use synonyms
such
as vegetables, fruit, Linking Words
meat
, bread, and seafood, in Australia over a ten-year period from 1950 to 2010. Use synonyms
Overall
, by 2010, Linking Words
consumption
had increased in all Use synonyms
food
categories except for Use synonyms
meat
, which had declined.
The most popular Use synonyms
food
which was eaten by Australians in the given period of time was vegetables. Use synonyms
Although
Linking Words
,
it can be seen from the graph that the line fluctuated, Remove the comma
apply
however
, Linking Words
at the end
, there were still 160 Linking Words
kg
of vegetables consumed in 2010. For Use synonyms
meat
Use synonyms
consumption
, in 1950, about 110 Use synonyms
kg
was consumed per person annually. There was a decline in Use synonyms
meat
Use synonyms
consumption
from 1980 to 2000. Use synonyms
Initially
, Linking Words
meat
was the second most popular, Use synonyms
however
, there was a significant drop, and the result was Linking Words
meat
ranked third in 2010. The Use synonyms
consumption
of fruit which was 30 Use synonyms
kg
below the Use synonyms
meat
made a dramatic increase in 1970-2010, making fruit the second most popular Use synonyms
food
.
From 1950-1970, the Use synonyms
consumption
of bread rose moderately, Use synonyms
however
, in 1970-2000, it plummeted until 2000 and it Linking Words
starts
to have a slight increase Wrong verb form
started
at the end
. Linking Words
In contrast
, there were no significant changes Linking Words
for
seafood Change preposition
in
consumption
as the line shows steady growth.Use synonyms