The bar chart shows the percentages of the Canadian workforce in five major industries in 1850 and 2020. Summarise the information by selecting and reporting the main features, and make comparisons where relevant.

The bar chart shows the percentages of the Canadian workforce in five major industries in 1850 and 2020.

Summarise the information by selecting and reporting the main features, and make comparisons where relevant.
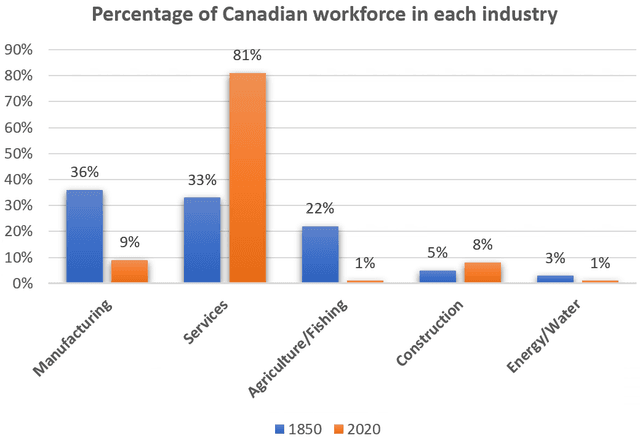
The bar chart illustrates the percentage of the work office of
Canadian
Fix the agreement mistake
Canadians
show examples
for 5 different industries in
years
Correct article usage
the years
show examples
1850 and 2020.
Overall
, in 2020,services
reaches
Wrong verb form
reached
show examples
81%,
compare
Change the form of the verb
compared
show examples
to 1850 it was just 33%.
Also
,
agriculture
Change preposition
in agriculture
show examples
and fishing industries in 2020
it
Correct pronoun usage
apply
show examples
was just 1% same as energy and water in the same year. In 2020, manufacturing and
constructin
Correct your spelling
construction
industries
was
Change the verb form
were
show examples
between 8% to 9%.
Submitted by shahooda7777 on

Unauthorized use and/or duplication of this material without express and written permission from this site’s author and/or owner is strictly prohibited. Excerpts and links may be used, provided that full and clear credit is given to Writing9 with appropriate and specific direction to the original content.

Sentences: Add more complex sentences.
Common mistake: Your writing should be 150-250 words.
Basic structure: Change the third paragraph.
Vocabulary: Only 5 basic words for charts were used.
Vocabulary: Use several vocabularies to present the data in the third paragraph.
What to do next:
Look at other essays: