
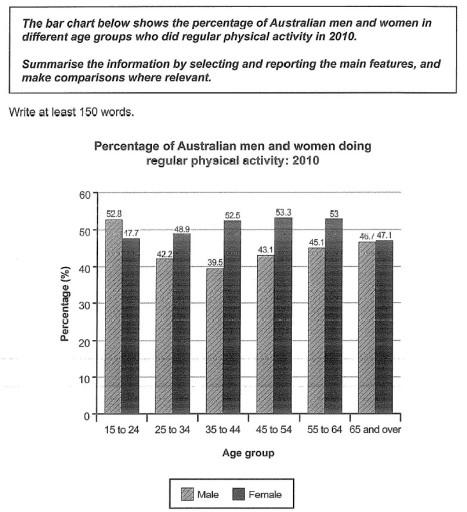
The chart gives information about Australian men’s and women’s regular physical activity in 2010,
number
of males and females and Correct article usage
the number
average
between age groups. Figures are given for six categories from 15-24 to 65 and over years old.
It’s clear from Correct article usage
the average
chart
that there is only 1 part 15-24 where Add an article
the chart
Correct article usage
the males
males
number is higher meanwhile other parts have a privilege Change the noun form
male
in
females. Change preposition
of
Although
Linking Words
last
bar 65 and over shows us Linking Words
minimum
difference in amount of people who were leading active Add an article
the minimum
lifestyle
.
The data of Australian citizens aged from 25 to 64 years old provided information that more Fix the agreement mistake
lifestyles
womanhood
were doing regular exercises. Replace the word
women
Maximum
percentage of active womankind viewed in Correct article usage
The maximum
45
to 54 age bracket, minimum was in Correct article usage
the 45
Linking Words
last
section.
Change the article
the last
According to
the Linking Words
chart
the biggest part of men consisted Add a comma
chart,
52.8
%, on the other side woman’s top was 53%, Change preposition
of 52.8
minimum
indicators were 39.5% and 47.1% respectively. Superior limits between sexes were 5.1% and 13%, inferior limit was 0.4%.Correct word choice
and minimum