
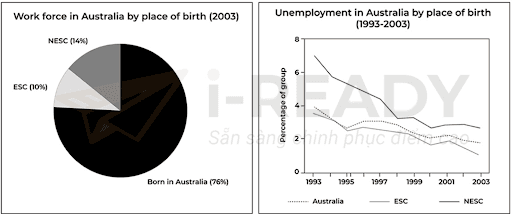
The pie chart and line graph
depicts
the Correct subject-verb agreement
depict
figure
for three different types in London and the unemployment percentage of selected groups from 1993 to 2003.
Fix the agreement mistake
figures
Overall
, half Linking Words
Use synonyms
people
Correct article usage
the people
work
in London Correct pronoun usage
who work
were
locals, Wrong verb form
are
while
very few Linking Words
people
Use synonyms
came
from Wrong verb form
come
English
-speaking countries. Use synonyms
Although
Linking Words
,
the unemployment rate of all groups dropped after a decade, folks who spoke Remove the comma
apply
English
but were not native Use synonyms
Londoners
were in highly rate of losing their jobs and the fewest Use synonyms
Non-
Correct your spelling
non-English-speaking
English
-speaking Use synonyms
people
were fired in the beginning.
Looking at the graph in more detail, there were 8% Use synonyms
Change preposition
of employee
employee
Fix the agreement mistake
employees
whose
Correct your spelling
who were
English
Use synonyms
was
fluent Unnecessary verb
apply
losing
their work, socially, there Wrong verb form
lost
were
only differing Correct subject-verb agreement
was
by
1% between the locals and Change preposition
of
people
whose mother tongue was not Use synonyms
English
, with 4% and 3%, respectively. About four years later, only figures for native Use synonyms
Londoners
rose to 5%, Use synonyms
while
the others were diminished to around 7% and 2.4%. In the Linking Words
last
year, all categories plummeted to 3%, 2% and 1%, and there was the same ranking, which was Linking Words
English
-speaking Use synonyms
people
leading the way, Use synonyms
following
by native Wrong verb form
followed
Londoners
and Non-Use synonyms
English
-speaking Use synonyms
people
.
Use synonyms
It is clear that
in Linking Words
London
employment market, employers preferred to recruit native Correct article usage
the London
Londoners
, which accounted for 50%, incredibly, for those whose countries adopted Use synonyms
English
Use synonyms
was
their prior language were extremely lower than Correct your spelling
as
people
who were not Use synonyms
English
speaking, with 8% and 42%.Use synonyms