
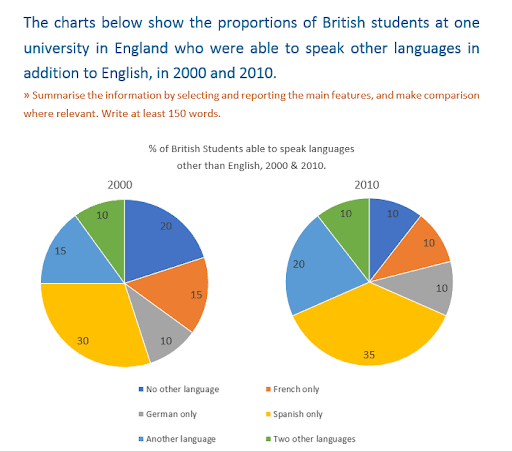
The two pie charts provide information about the percentages of British
pupils
who can speak different Use synonyms
languages
Use synonyms
besides
English at a particular university in England in 2000 and 2010.
Linking Words
It is clear that
the majority of British Linking Words
pupils
speak only Spanish in both years. Use synonyms
Moreover
, in 2010, the percentage of Linking Words
pupils
who could not speak any other Use synonyms
languages
saw a decrease. At that time, more Use synonyms
students
could speak more than two other Use synonyms
languages
.
Looking at the information in more detail, in 2000, the Use synonyms
students
who were Spanish Use synonyms
speakers
were 1.5 times as many as the Use synonyms
students
who could only speak English. As for French Use synonyms
speakers
and German Use synonyms
speakers
, the percentages of the former constituted 15%, and the latter Use synonyms
languages
accounted for 10%.
Compared to 2000, 15% of Use synonyms
students
had the ability to speak two other Use synonyms
languages
in 2010. Use synonyms
While
French Linking Words
speakers
and German Use synonyms
speakers
showed the same proportion of 10%, the Use synonyms
pupils
who could speak only Spanish remained the primary constituency at 35% of the total during the given period.Use synonyms