The graph on the right shows the unemployment figures amongst women of different age groups.

The graph on the right shows the 

unemployment figures amongst women of 

different age groups.
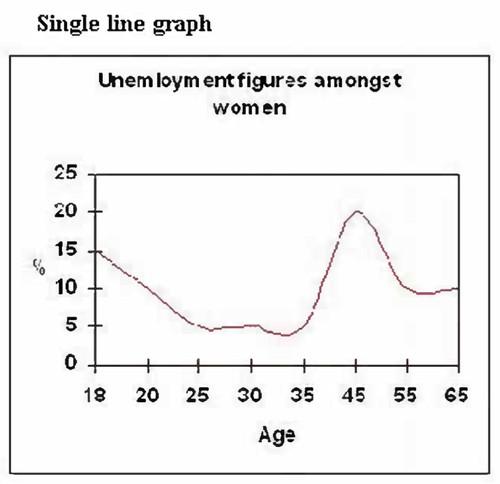
The graph shows percentages of unemployed
women
at 8
ages
. It can be clearly seen that the
ages
18 and 45 have the highest
unemployment
rate.
According to
the graph, among the
ages
18, 20, 25, 30 and 35, the youngest
women
have the highest
unemployment
percentage (15%).
20 year-old
Add a hyphen
20-year-old
show examples
women
have much lower
unemployment
figures (about 10%), and percentages drop even lower (to 5
percent
Change the spelling
per cent
show examples
) for those aged 25 and 35. There is a slight increase for those aged 30, where the
unemployment
rate reaches 6
percent
Change the spelling
per cent
show examples
. The peak value is recorded amongst
45 year-old
Add a hyphen
45-year-old
show examples
women
, and all the remaining
ages
have much lower figures: 8% at age 55 and 9% at age 65.
To sum up
, the figures for most
ages
are relatively uniform and change from 5 to 9 %, with rare exceptions
such
as the
ages
18 and 45.

Unauthorized use and/or duplication of this material without express and written permission from this site’s author and/or owner is strictly prohibited. Excerpts and links may be used, provided that full and clear credit is given to Writing9 with appropriate and specific direction to the original content.

Basic structure: Use less body paragraphs.
Common mistake: Your writing should be 150-250 words.
Basic structure: Change the second paragraph.
Basic structure: Change the seventh paragraph.
Basic structure: Change the tenth paragraph.
Vocabulary: Replace the words women, ages, unemployment with synonyms.
Vocabulary: Rephrase the word "shows" in your introduction.
Vocabulary: The word "graph" was used 2 times.
Vocabulary: The word "figures" was used 3 times.
Vocabulary: The word "percentages" was used 3 times.
Vocabulary: Use several vocabularies to present the data in the second paragraph.
Vocabulary: Use several vocabularies to present the data in the seventh paragraph.
Vocabulary: Use several vocabularies to present the data in the tenth paragraph.
What to do next:
Look at other essays: