
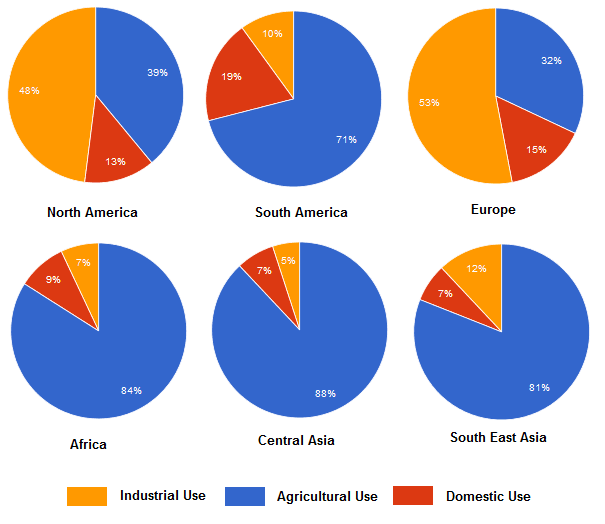
The provided illustration compares
water
Use synonyms
consumption
for three main purposes in six different areas namely: North Use synonyms
America
, South Use synonyms
America
, Use synonyms
Europe
, Africa, Central Asia and South East Asia. Use synonyms
Overall
, it is clear from the charts that Linking Words
Asian
and Use synonyms
African
countries used more Use synonyms
water
for irrigation Use synonyms
while
North American and European countries used more Linking Words
water
for their industrial needs.
Use synonyms
To begin
with, a major portion of Linking Words
water
Use synonyms
consumption
could be observed in the agricultural sector and Use synonyms
this
was higher in Linking Words
African
and Use synonyms
Asian
regions than that Use synonyms
of
American and European parts. More than 80% of Change preposition
in
water
in Africa and Asia went into agricultural fields Use synonyms
while
Linking Words
this
percentage was only 32% in Linking Words
Europe
and 39% in North Use synonyms
America
. North Use synonyms
America
and Use synonyms
Europe
required more Use synonyms
water
in their industrial sectors than that Use synonyms
of
Change preposition
in
Asian
and Use synonyms
African
countries. Use synonyms
While
half of the Linking Words
water
was used in the industrial sector in North Use synonyms
America
and Use synonyms
Europe
, the percentage of that in Use synonyms
African
and Use synonyms
Asian
regions ranged from 5% to 12%. Interestingly, Use synonyms
water
Use synonyms
consumption
in North and South Use synonyms
America
shows a contrasting scenario. Use synonyms
Finally
, more percentages of household Linking Words
water
Use synonyms
consumption
could be observed in American and European continents than that Use synonyms
of
Change preposition
in
Asian
and Use synonyms
African
regions.Use synonyms