
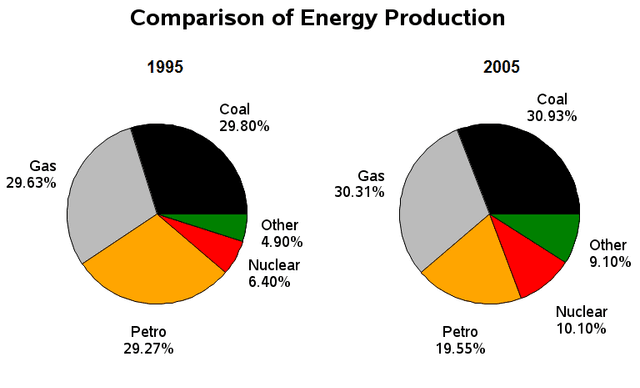
The charts illustrate various kinds of
energy
which were produced in the Use synonyms
the
UK in 1995 and 2005. Remove the redundancy
apply
Overall
, coal and Linking Words
gas
were the most Use synonyms
common
produced kinds of Change the word
commonly
Use synonyms
engergy
in both years.
In 1995, it was clearly shown that coal, Correct your spelling
energy
gas
and petrol were the most popular types of Use synonyms
energy
produced during Use synonyms
this
year. To be more specific, the Linking Words
firgue
of those three Correct your spelling
figure
virtue
sources
of Use synonyms
energy
is relatively the same, at 29.80%, 29.63% and 29.27% respectively. It was Use synonyms
then
followed by nuclear, which was only allocated 6.4%. Linking Words
Furthermore
, only under 5% of Linking Words
energy
was generated by other Use synonyms
sources
of Use synonyms
Use synonyms
engergy
.
In 2005, most of the Correct your spelling
energy
energy
was generated by coal and Use synonyms
gas
, in which, coal and Use synonyms
gas
shared the two even parts of 30.93% and 30.31% respectively. Petrol followed with around 19.55% of Use synonyms
Use synonyms
engergy
Correct your spelling
energy
was
produced. Unnecessary verb
apply
Besides
, nuclear only accounted for nearly a tenth of Linking Words
total
Correct article usage
the total
Use synonyms
engergy
Correct your spelling
energy
was
produced. Unnecessary verb
apply
Lastly
, other Linking Words
sources
of Use synonyms
energy
produced only 9.10% of Use synonyms
Use synonyms
engergy
Correct your spelling
energy
comparing
to other Wrong verb form
compared
sources
.Use synonyms