
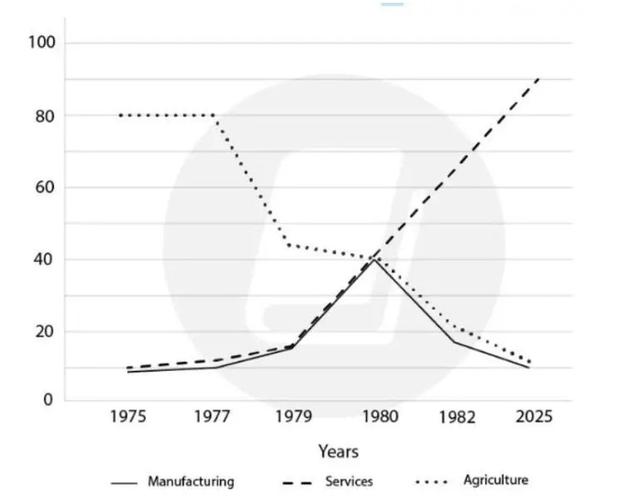
The line graph explains the quantities of
jobs
in the United States and millions. Use synonyms
Also
, the graph describes the possible tendencies in Linking Words
up-coming
years.
Correct your spelling
upcoming
Overall
, between 1975 Linking Words
an
2025 service employment races in the USA Correct your spelling
and
while
, manufacturing Linking Words
jobs
fluctuate in agriculture employment drastically decreases.
Use synonyms
Additionally
, Linking Words
jobs
in the service industry begin with only 10 Use synonyms
million
Use synonyms
employees
in 1975. Use synonyms
Moreover
, it wasn't until 1979 by the Linking Words
quantity
of Change the quantifier
number
jobs
in the sector rose Use synonyms
up
to 80 Change preposition
apply
million
, with a prediction of 90 Use synonyms
million
Use synonyms
employees
in 2025.
Use synonyms
On the other hand
, agriculture Linking Words
jobs
were Use synonyms
mostly
popular in 1975 holding 80 Replace the word
most
million
Use synonyms
employees
. Use synonyms
Although
, Linking Words
this
amount plunged dramatically in 1979 and continue to deteriorate in future years. Linking Words
Finally
, the number of people who worked in manufacturing began with 10 Linking Words
million
Use synonyms
jobs
in 1975 and peaked in the 1980s with a total of 40 Use synonyms
million
Use synonyms
employees
. Use synonyms
To sum up
, the most dramatic rise in Linking Words
quantity
of Add an article
the quantity
jobs
inside the line mapUse synonyms
,
is Remove the comma
apply
the
service field of work. And in comparison, the manufacturing and agriculture Change preposition
in the
jobs
show a consistent fall in the number of Use synonyms
employees
Use synonyms
through
the years Change preposition
between
of
1975 and 2025.Change preposition
apply