
The given line graphs illustrate the production and
demand
for steel in a million tons and the Use synonyms
number
of employees working In the metal factory in the UK in 2010.
Use synonyms
Overall
, the first graph shows the Linking Words
demand
for steel has an unstable Use synonyms
number
from Use synonyms
January
to Use synonyms
December
. The second line shows that workers in the early months of the year Use synonyms
is
higher than in the Change the verb form
are
last
three month of the year.
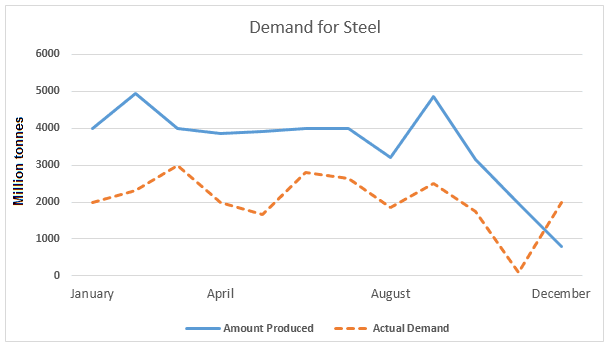
The first graph depicts the Linking Words
demand
for steel in the market. The amount produced between Use synonyms
January
to Use synonyms
December
experienced fluctuating production. In Use synonyms
January
the Use synonyms
number
starts at 4000, from April to the end of July the Use synonyms
number
is almost the same. The increase happens Use synonyms
in
August to October and in Change preposition
from
December
it becomes under 1000. The actual Use synonyms
demand
in Use synonyms
January
at 2000 and in Use synonyms
December
returned to 2000 after experiencing fluctuation Use synonyms
in
February to November.
The second graph shows the Change preposition
from
number
of employees in Use synonyms
January
at 5000 and comes to April the Use synonyms
number
is decreasing and experiencing changes till Use synonyms
December
. From April to Use synonyms
December
the Use synonyms
number
falls, but in August the Use synonyms
number
of employees slightly rises by 3500 and turns to a low Use synonyms
number
at 1000 in Use synonyms
December
.Use synonyms