
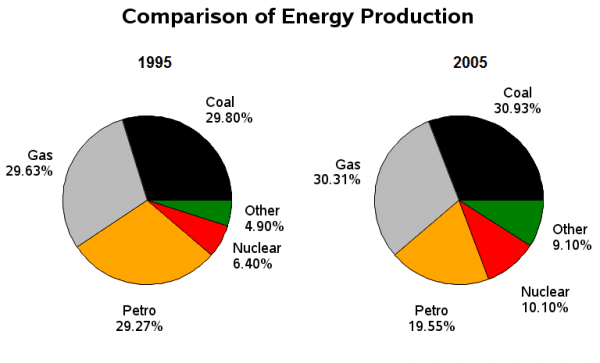
The pie charts
illustarte
how various Correct your spelling
illustrate
kind
of Fix the agreement mistake
kinds
energy
Use synonyms
produced
in France in the Add a missing verb
were produced
year
Use synonyms
of
1995 and 2005.
Change preposition
apply
Overall
,in both years Coal and Gas were the largest Linking Words
source
of Change the noun form
sources
energy
Use synonyms
while
Linking Words
,
Remove the comma
apply
least
generated electricity were Nuclear and other kinds . Among all types of Correct article usage
the least
Use synonyms
energy
only Petro showed some Add a comma
energy,
decrase
in the second Correct your spelling
decrease
decreased
year
.
In detail, both Coal and Gas hadUse synonyms
Correct your spelling
a little
little
alittle incrase
in 2005. They were 29. 80% and 29.63% in 1995. It shows that onlyCorrect your spelling
a little increase
1
% increase about 30.93% and 30.31% Correct article usage
a 1
in
after 10 Change preposition
apply
Use synonyms
year
. Which together accounted for over half Change to a plural noun
years
trhe
production of Correct your spelling
the
energy
in both 1995 and 2005.
Electricity produced by Nuclear was 6.40% in the Use synonyms
year
1995 and it rose to 10.10% in 2005. Other kinds of Use synonyms
energy
were Use synonyms
also
increased Linking Words
slighhtly
after 10 Correct your spelling
slightly
Use synonyms
year
. Change to a plural noun
years
In contrast
, Petro was the only electricity generated was reduced in 2005 . It declined Linking Words
nealt
10%.Correct your spelling
nearly