
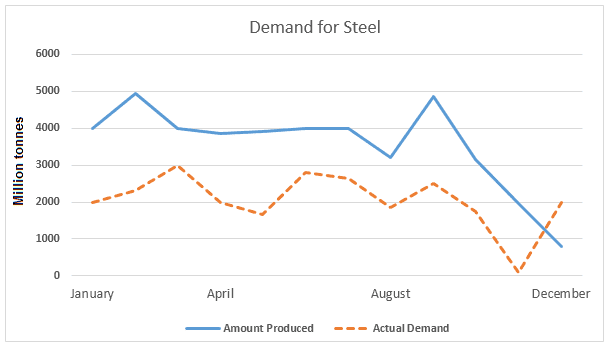
The first line chart describes how the manufacturing and need for
steel
changed in the UK in 2010, Use synonyms
while
the second line graph provides information about how many workers were hired in the Linking Words
steel
sector in the same period and location.
Use synonyms
Overall
, the monthly amounts of Linking Words
steel
produced were consistently higher than those of actual demand, except for December because of a significant decline in Use synonyms
this
Linking Words
month
. Use synonyms
In addition
, the number of people working in Linking Words
this
industry saw a considerable drop throughout the year.
In January 2010, 4.000 Linking Words
million
tonnes of Use synonyms
steel
were manufactured in the UK, followed by a fluctuation in the range from 5.000 Use synonyms
million
to 3.500 Use synonyms
million
every Use synonyms
month
before experiencing a sharp decrease to under 1.000 Use synonyms
million
in December. Use synonyms
Conversely
, despite some fluxes, the volumes of actual requests in the first and the Linking Words
last
Linking Words
month
of Use synonyms
this
year remained exactly at 2.000 Linking Words
million
.
The Use synonyms
steel
industry had 5.000 employees at the beginning of the stage examined,Use synonyms
,
after which it slightly grew to approximately 6.000 in February before witnessing a downward trend in the next Change the punctuation
apply
month
. The total of steelworkers continuously tumbled in the later course of Use synonyms
this
year, ending at around 1.000.Linking Words