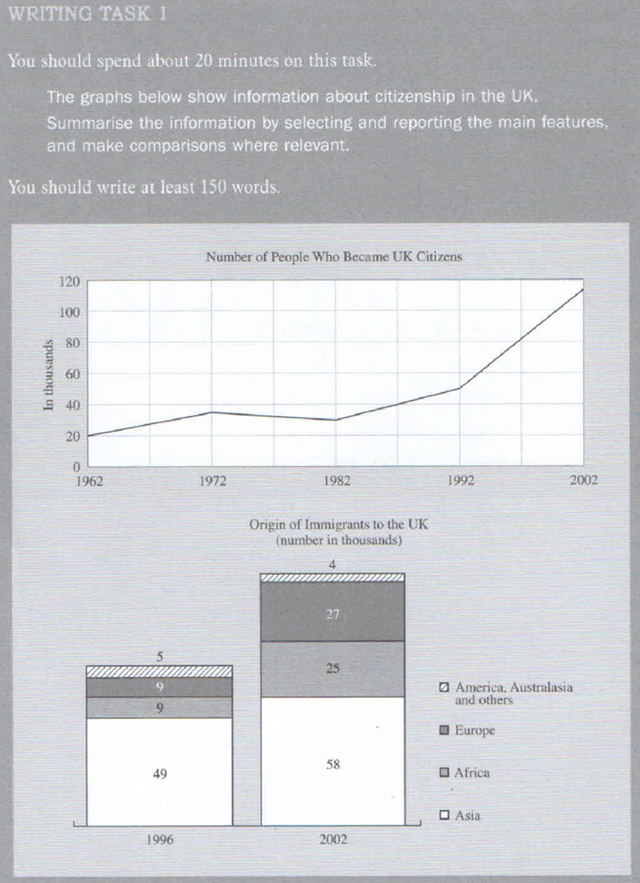
Two charts: a line graph shows the number of people granted UK citizenship (in thousands) from 1992 to 2002 and a bar graph illustrates the number of people (in thousands) from Asia, Africa, America, Europe, Australia, and others, receiving UK citizenship in 1996 and 2002. Summarise the information by selecting and reporting the main features and make comparisons where relevant.

Two charts: a line graph shows the number of people granted UK citizenship (in thousands) 

from 1992 to 2002 and a bar graph illustrates the number of people (in thousands) from Asia, Africa, America, Europe, Australia, and others, receiving UK citizenship in 1996 and 2002. 

Summarise the information by selecting and reporting the main features and make 

 comparisons where relevant.
The tables
demonstrates
Change the verb form
demonstrate
show examples
the number of
people
who became UK citizen from 1962 to 2002 and their origin , including 4 groups which are Asia, Africa, Europe and America, Australasia and others in 1996 and 2002.
Overall
, the line graph's data reveals a significant increase in the number of UK citizens between 1992 and 2002.
Otherwise
, the bar chart shows that the rate of immigrants had an enormous rise in 2002, compared to the one in 1996. It can be seen from both graphs that the data is almost always increased. From 1962 to 1972, the population increased from 20000 to nearly 40000. After that, it had a tiny dip in 1982 but in 1992 it went up rapidly to 50000 and 110000 in 2002.
On the other hand
, we can see that there is a huge difference in the ratio of origin of immigrants to the UK, The Asia group took a huge space in the bar chart in 1996 which was 49000
people
,
whereas
Europe and Africa just have 9000
people
and America, Australasia and other was the lowest with just 5000
people
. In 2002, it seems to have remained a gap in the ratio of origin but the number of
people
was increased.
Submitted by yeshomeclass on

Unauthorized use and/or duplication of this material without express and written permission from this site’s author and/or owner is strictly prohibited. Excerpts and links may be used, provided that full and clear credit is given to Writing9 with appropriate and specific direction to the original content.

Introduction: The introduction is missing.
Introduction: Change the first sentence in the introduction.
Introduction: The chart intro is missing.
Vocabulary: Replace the words people with synonyms.
Vocabulary: Rephrase the word "number of" in your introduction.
Vocabulary: The word "chart" was used 2 times.
Vocabulary: The word "graphs" was used 2 times.
Vocabulary: The word "data" was used 2 times.
Vocabulary: The word "number of" was used 3 times.
Vocabulary: The word "ratio" was used 2 times.
Vocabulary: The word "increase" was used 4 times.
What to do next:
Look at other essays: