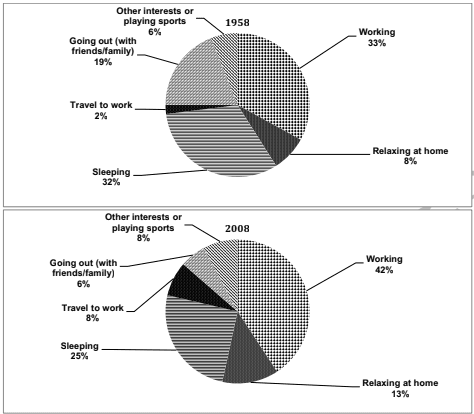
You should spend about 20 minutes on this task. The pie charts below show the percentage of time working adults spent on different activities in a particular country in 1958 and 2008. Summarise the information by selecting and reporting the main features and make comparisons where relevant You should write at least 150 words.

You should spend about 20 minutes on this task.

The pie charts below show the percentage of time working adults spent on different activities in a particular country in 1958 and 2008. Summarise the information by selecting and reporting the main features and make comparisons where relevant

You should write at least 150 words.
The
given
Verb problem
apply
show examples
pie chart
illustrate
Change the verb form
illustrates
show examples
the difference in time consumption of working
adults
in various activities in
a
Correct article usage
the
show examples
same country but in different years.
Overall
there was a noticeable change in percentage in the given years. In 1958, 33 percent
adults
Change preposition
of adults
show examples
were working and
the
Correct article usage
apply
show examples
2% were traveling for work.
While
8% were relaxing at home ,
also
the 32%
adults
Change preposition
of adults
show examples
were sleeping.
And the
Correct word choice
The
show examples
19%
were enjoying by
Wrong verb form
enjoyed
show examples
going out with their friends and family
while
the left 6%
were having
Wrong verb form
had
show examples
other
interest
Fix the agreement mistake
interests
show examples
like playing sports. Moving towards 2008, there
is
Change the verb form
are
show examples
42%
adults
Change preposition
of adults
show examples
who
Correct pronoun usage
apply
show examples
were working and
the
Correct article usage
apply
show examples
8% were
traveling
Change the spelling
travelling
show examples
for work.
On the other hand
, 13% were relaxing and
the
Correct article usage
apply
show examples
25% of
adults
were sleeping. And
the
Correct article usage
a
show examples
13% decrease in the
adults
going out with their family, which is 6% and the rest of
8
Correct article usage
the 8
show examples
%
were having
Wrong verb form
had
show examples
other
interest
Fix the agreement mistake
interests
show examples
. In conclusion,
the
Remove the article
apply
show examples
both pie chart shows growth in
spending
Correct article usage
the spending
show examples
times of
adults
in 1958 compared to 2008. And 2008 is leading in
term
Fix the agreement mistake
terms
show examples
of increasing 9% of working and 6% of
adults
who were
traveling
Change the spelling
travelling
show examples
for work.
Submitted by hamnafatima535 on

Unauthorized use and/or duplication of this material without express and written permission from this site’s author and/or owner is strictly prohibited. Excerpts and links may be used, provided that full and clear credit is given to Writing9 with appropriate and specific direction to the original content.

Sentences: Add more complex sentences.
Linking words: Don't use the same linking words: "while".
Basic structure: Change the second paragraph.
Vocabulary: Replace the words adults with synonyms.
Vocabulary: The word "chart" was used 2 times.
Vocabulary: The word "give" was used 2 times.
Vocabulary: Use several vocabularies to present the data in the second paragraph.
Topic Vocabulary:
  • pie chart
  • percentage
  • activities
  • working adults
  • summarise
  • report
  • main features
  • comparisons
  • relevant
  • time spent
  • work-related
  • leisure
  • personal care
  • travel
  • noticeable trends
  • over a period
  • devoted
  • significant changes
  • contrast
  • compare
What to do next:
Look at other essays: